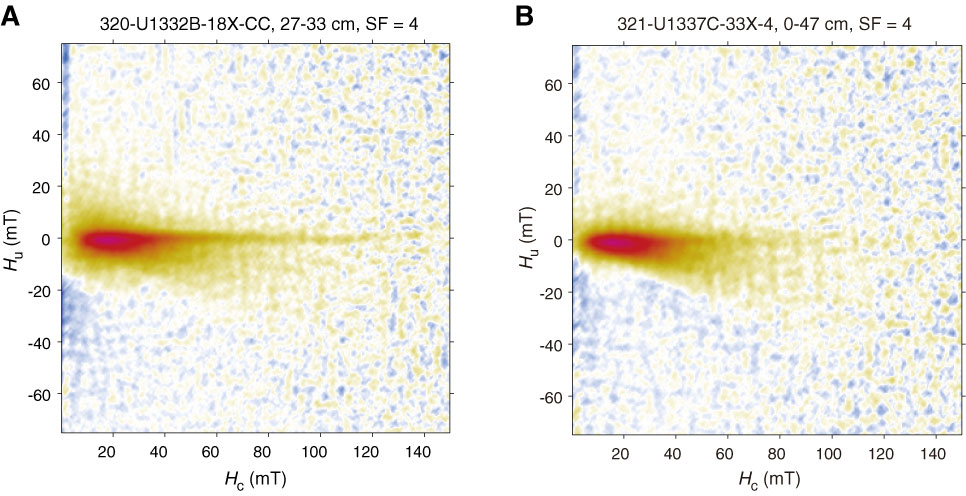
Figure F3. Representative first-order reversal curve (FORC) diagrams measured on chip samples from (A) Sample 320-U1332B-18X-CC, 27–33 cm, and (B) Sample 321-U1337C-33X-4, 0–47 cm. SF = smoothing factor, Hu = interacting field, Hc = coercivity.
Previous | Close | Next | Top of page