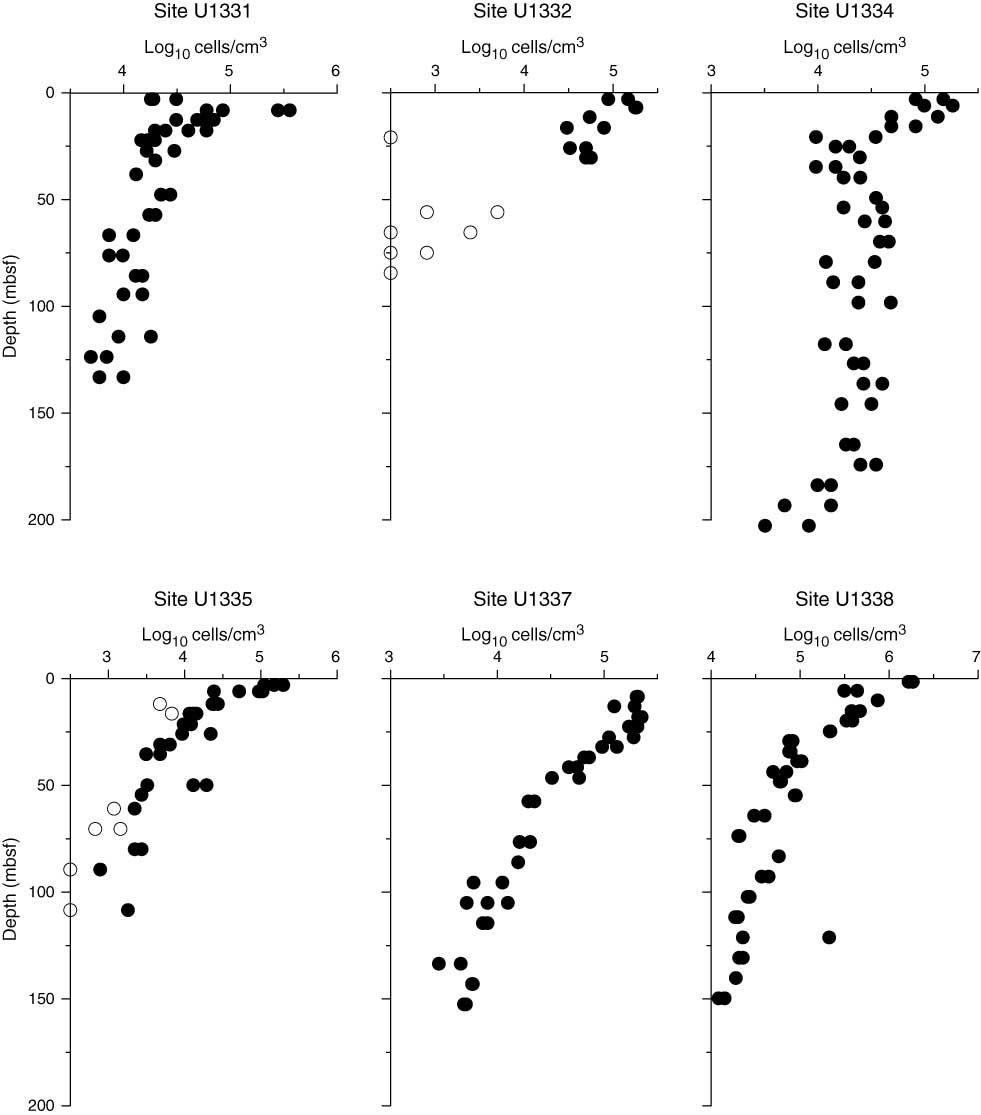
Figure F1. Cell abundance and distribution in drill cores retrieved during IODP Expedition 320/321. Solid circles mark cell counts above the minimum detection limit and open circles mark values below the minimum detection limit. Open circles directly on the y-axis indicate cell counts that were below the mean blank.