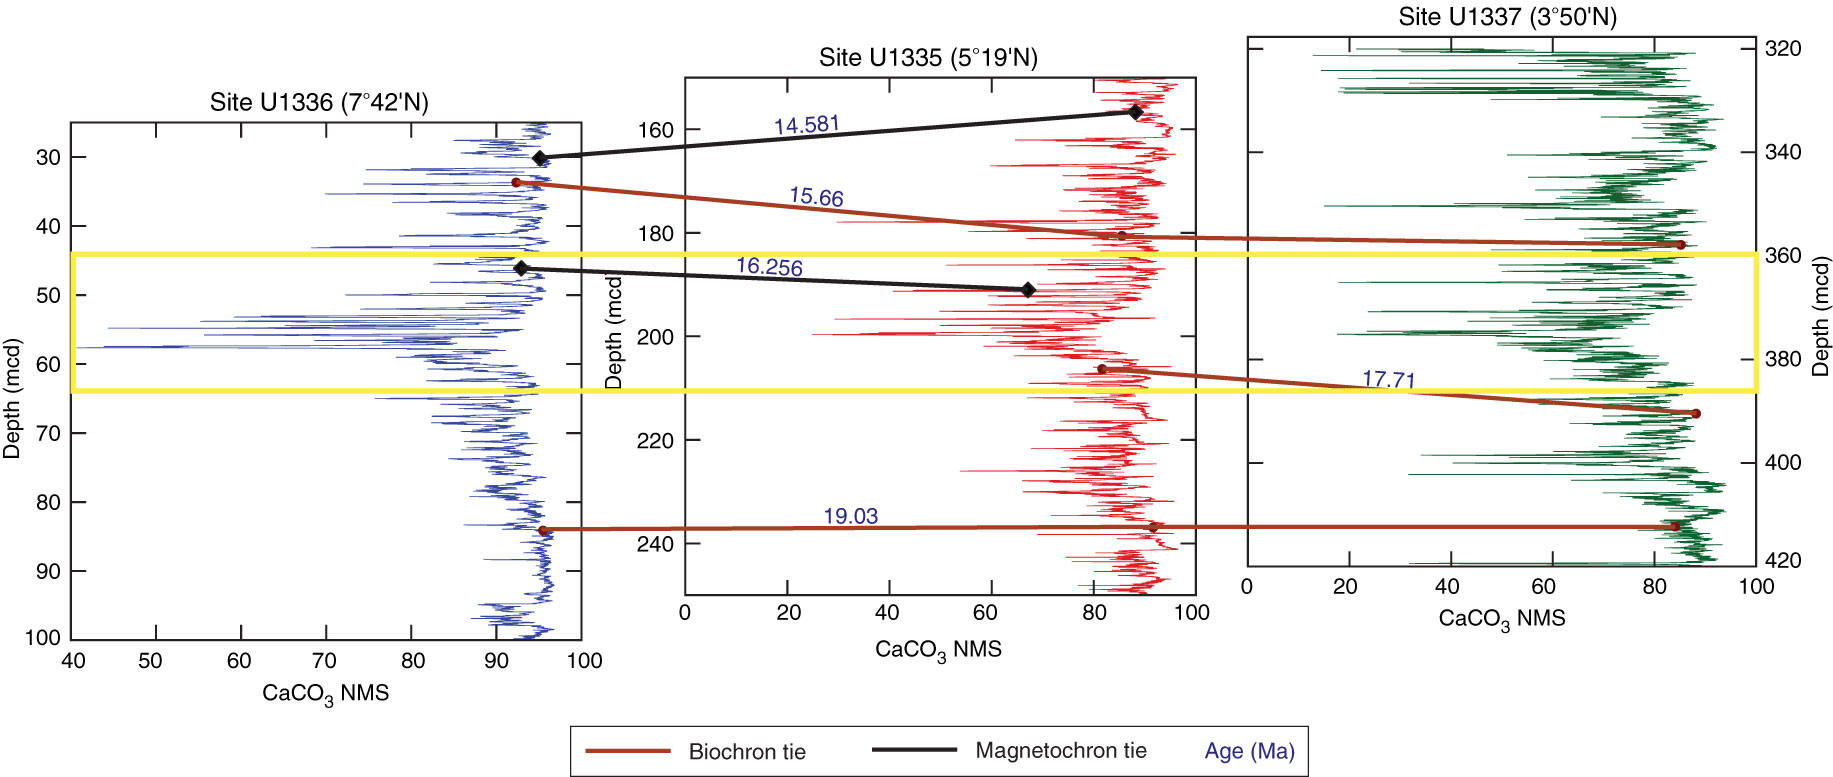
Figure F7. CaCO3 normalized median-squared (NMS) values and stratigraphic correlation between Sites U1335, U1336, and U1337 for the period of time surrounding the 17 Ma CaCO3 dissolution event. Ages are shown above the stratigraphic tie lines. Additionally, the primary CaCO3 dissolution signal of the 17 Ma event is outlined by a yellow box.
Previous | Close | Top of page