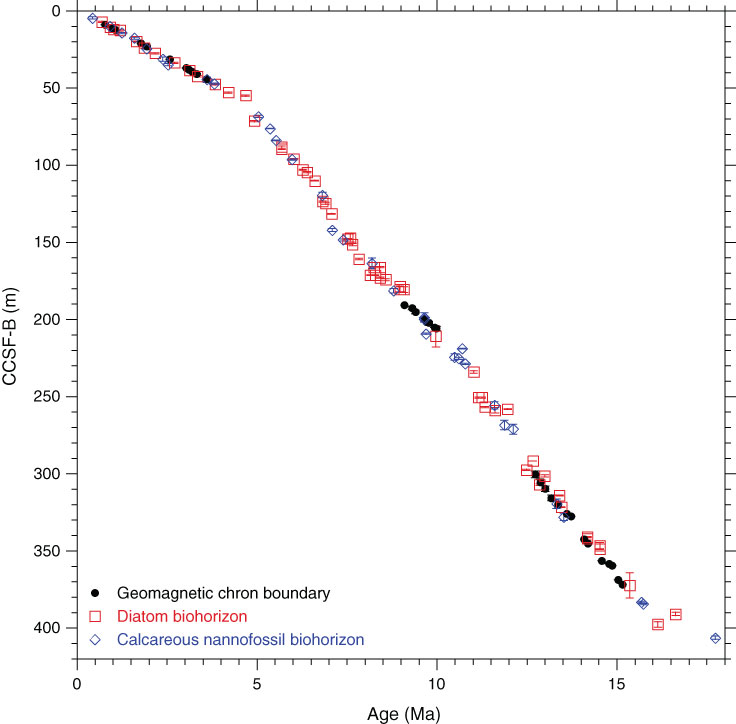
Figure F2. Biomagnetostratigraphic indicators, 0–18 Ma, Site U1338. Symbols are shown with error bars in the depth domain, representing the lowermost and uppermost depths of biohorizons and chron boundaries (Tables T1, T2, T3).
Previous | Close | Next | Top of page