Previous | Close | Next
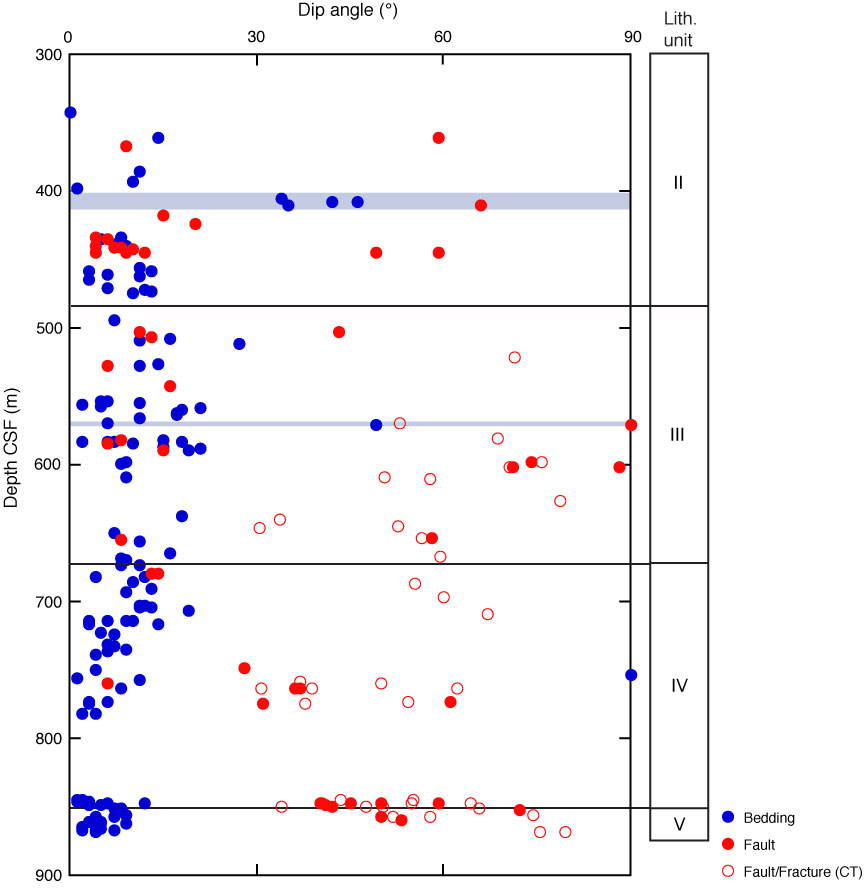
Figure F20. Dip angle variation of bedding and fault planes plotted against depth. Blue highlighted intervals correspond to chaotic deposits in core. CT = computed tomography.
Previous | Close | Next | Top of page