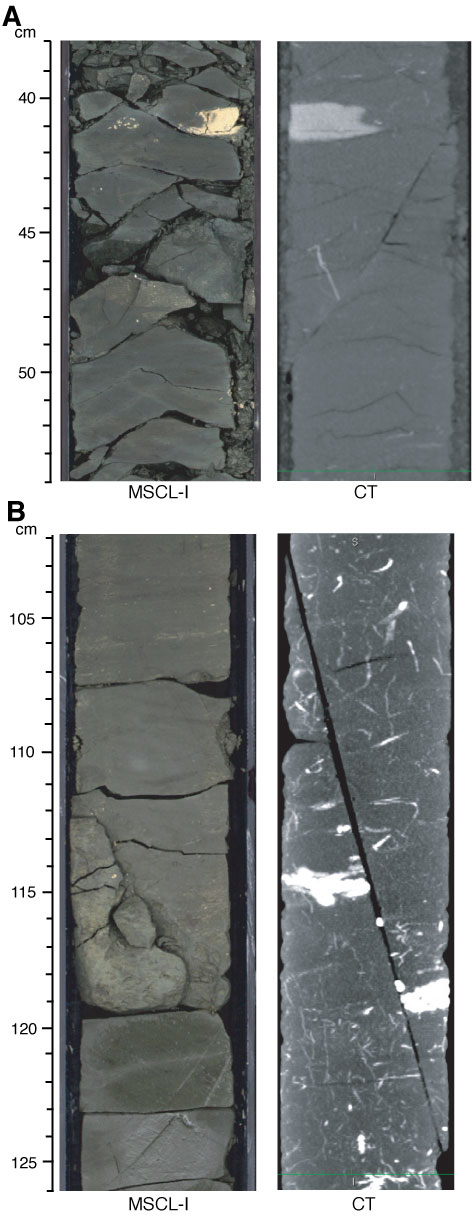
Figure F27. High-angle faults. X-ray computed tomography (CT) images show cross section parallel to the maximum inclination of the faults. A. Bright line, a possible burrow, is cut by fault (interval 322-C0011B-37R-8, 38–54 cm). B. Bright layer is displaced by fault (interval 322-C0011B-32R-1, 102–126 cm). MSCL-I = photo image logger.
Previous | Close | Next | Top of page