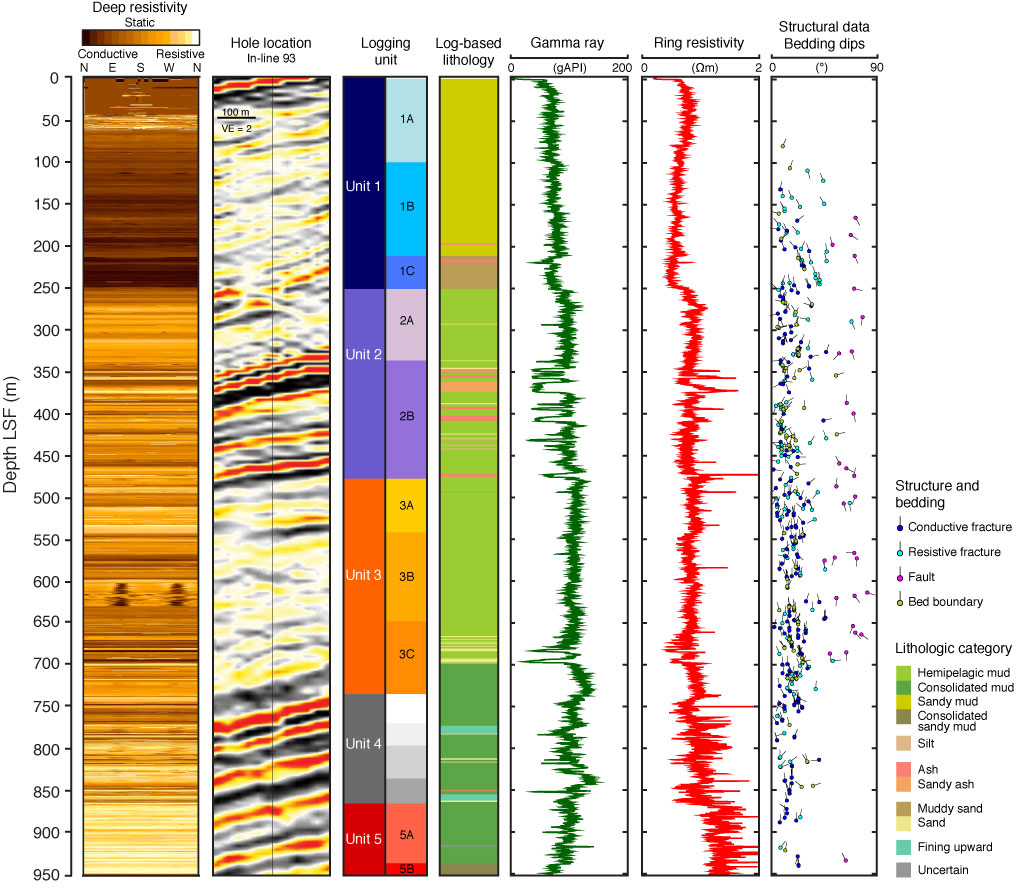
Figure F47. Depth-shifted LWD data from Hole C0011A showing resistivity image, seismic section, logging units, log-based lithologic interpretation, gamma ray, ring resistivity, and structural data and bedding dips. VE = vertical exaggeration.
Previous | Close | Next | Top of page