Previous | Close | Next
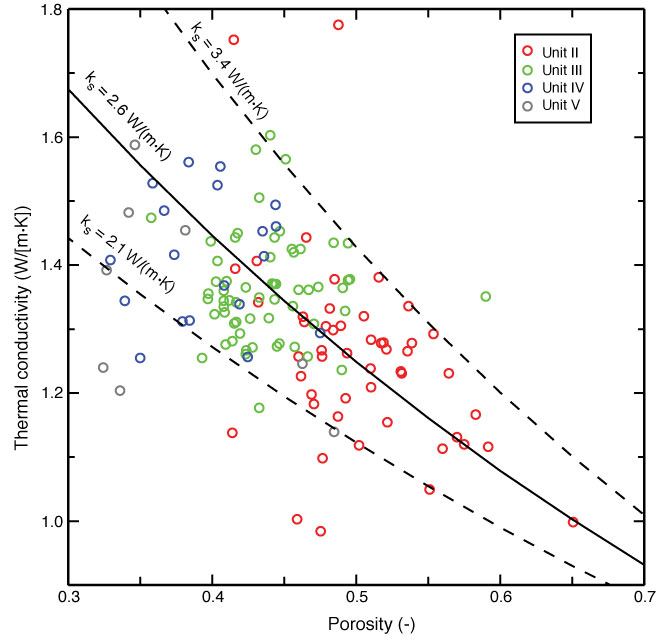
Figure F52. Porosity versus thermal conductivity of mud samples, Hole C0011B. Lines = theoretical values for different grain thermal conductivities (ks) based on a geometric mean mixing model.
Previous | Close | Next | Top of page