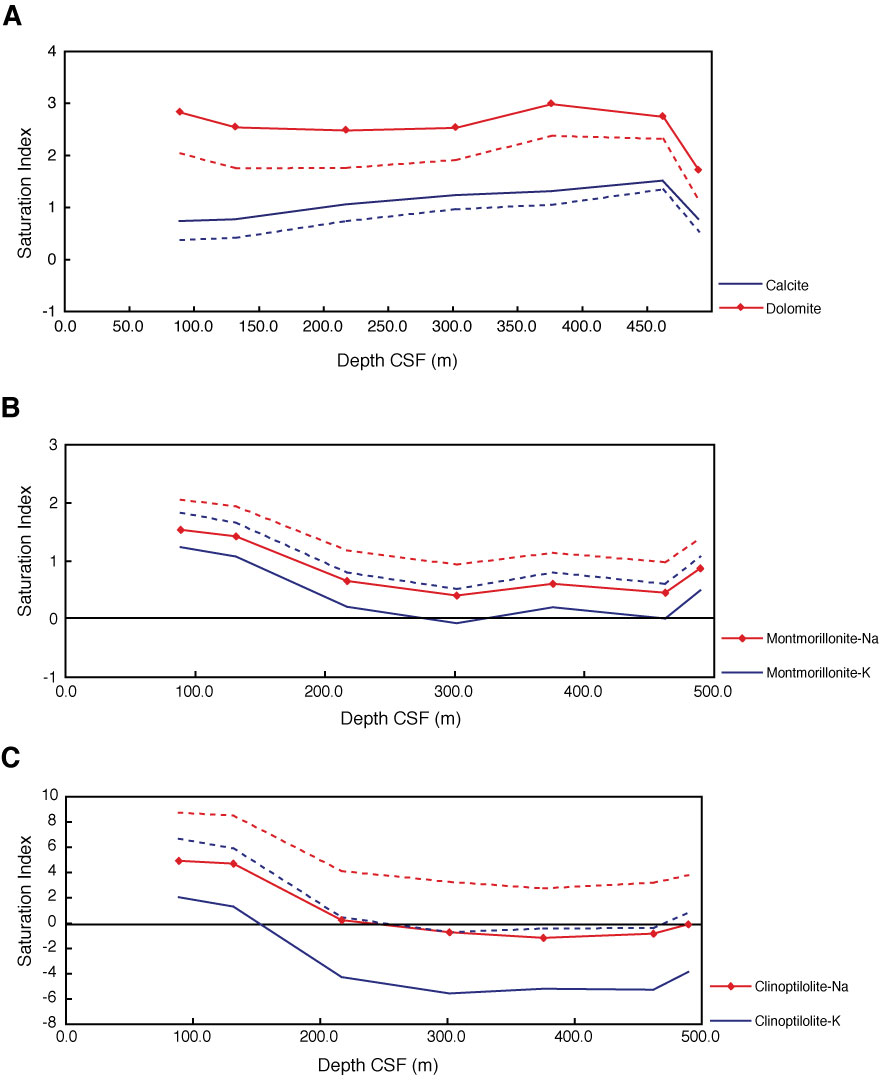
Figure F53. Depth distribution of saturation indexes estimated using pore fluid concentrations, pure end-member phases, and the PhreeqcI software package of Parkhurst and Appelo (1999). Calculations performed at 25°C (solid lines) and 5°C (dotted lines). A. Carbonates. B. Montmorillonites. C. Zeolites.

Previous | Close | Next | Top of page