Close | Next
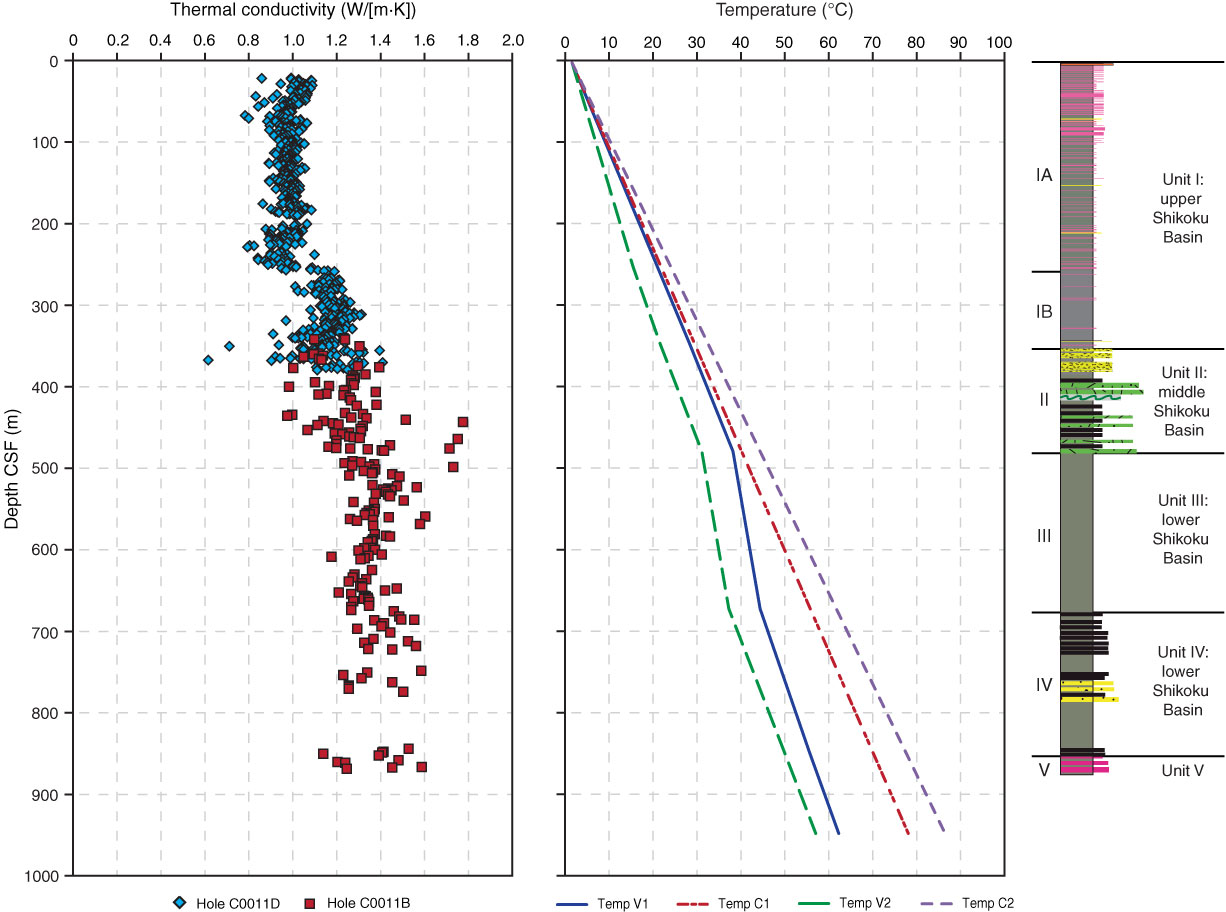
Figure F1. Temperature gradient calculated from the core-based thermal conductivities, showing both a consistent gradient and one with variations for the dominant lithology, Site C0011.
Close | Next | Top of page