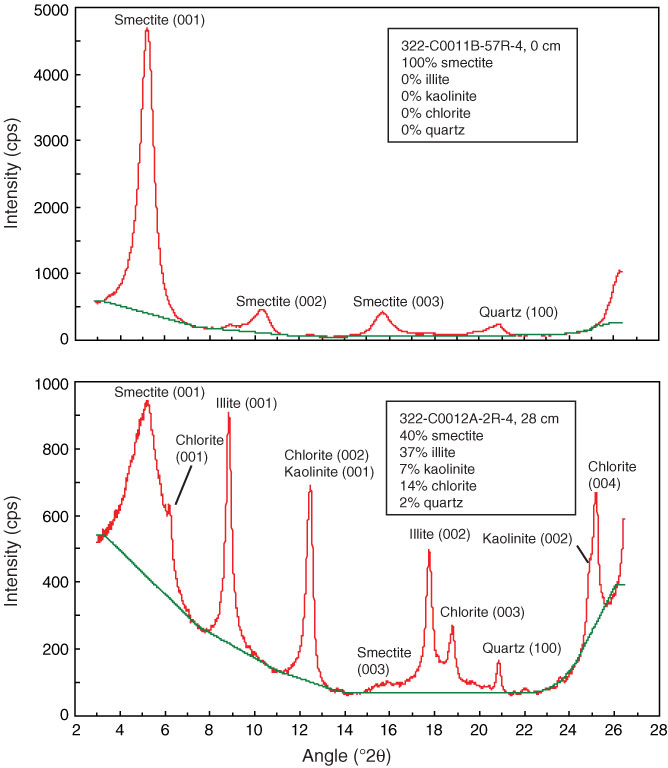
Figure F3. Representative examples of X-ray diffractograms showing peaks for smectite, illite, chlorite, kaolinite, and quartz, Sites C0011 and C0012. Values of relative mineral abundance (weight percent) were calculated using the SVD normalization factors of Underwood et al. (2003) and the following peak areas: smectite (001), illite (001), chlorite (002) + kaolinite (001), and quartz (100). Proportion of kaolinite to chlorite was calculated using the equations of Guo and Underwood (2011).
Previous | Close | Next | Top of page