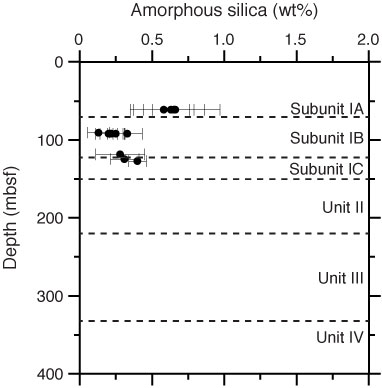
Figure F3. Plot of amorphous silica content of bulk sediment samples, Site C0012. Error bars indicate 95% confidence intervals. Horizontal dashed lines are lithologic unit and subunit boundaries from Expedition 333 Scientists (2012) and Underwood et al. (2010). Below the Subunit IA/IB boundary, ash layers become scarce and volcanic glass is more altered (Expedition 333 Scientists, 2012).
Previous | Close | Top of page