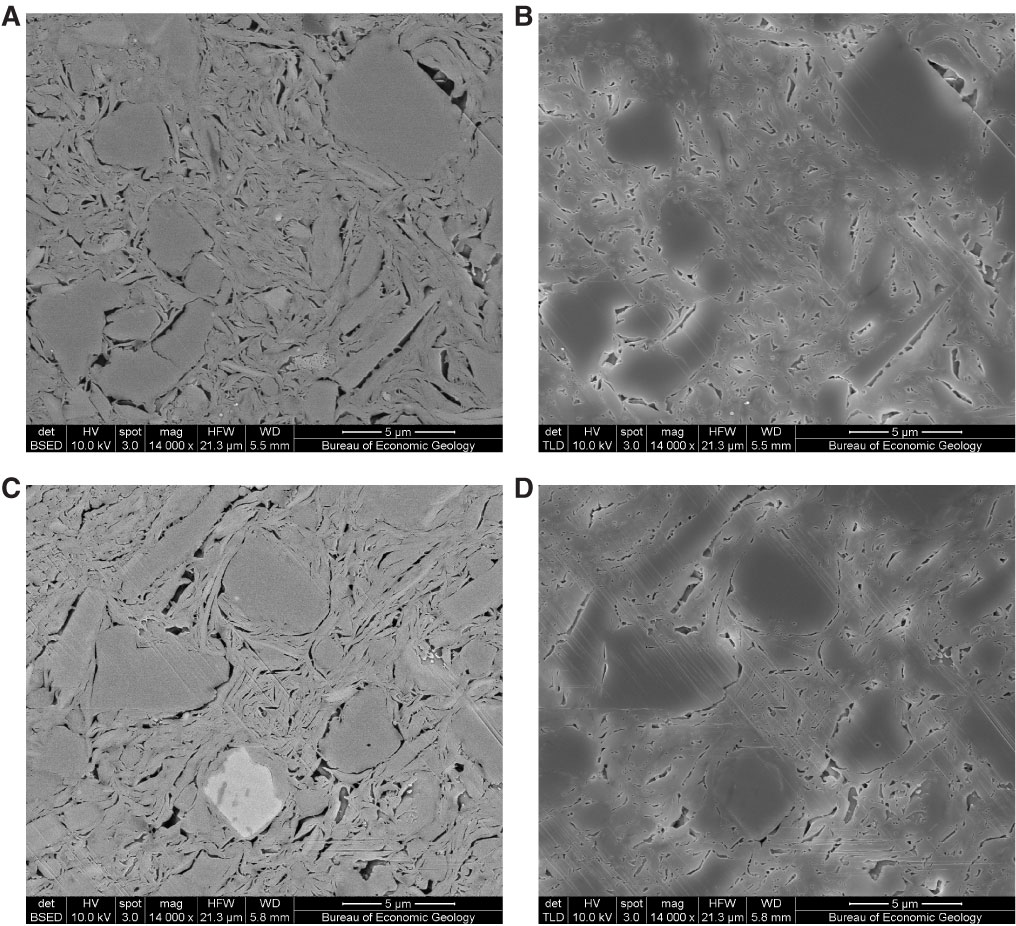
Figure F13. Scanning electron microscope images of Nankai silty claystone–silica mixtures after consolidation to a maximum vertical effective stress of 21 MPa. Images represent vertical cross section of samples (i.e., load was applied from the top of the images). Left column are BSE images. Right column are SE images. Magnification = 14,000×. Additional BSE and SE images are in SEM in “Supplementary material.” A, B. Nankai silty claystone (56% clay). C, D. 50% clay. (Continued on next two pages.)
Previous | Close | Next | Top of page