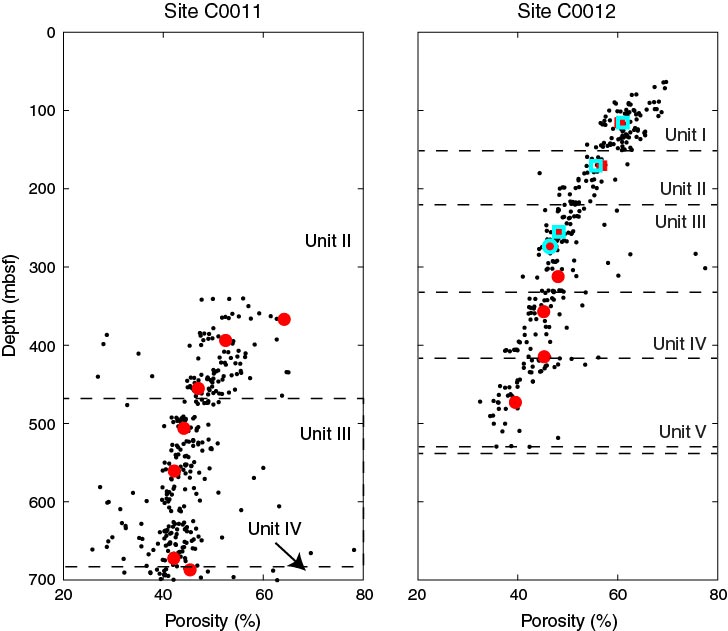
Figure F2. Comparison of moisture and density porosity determined shipboard (black dots) and on laboratory samples used in permeability experiments for Sites C0011 and C0012. Solid red circles = vertically oriented flow-through permeability specimens, open cyan circles = horizontally oriented flow-through permeability specimens, solid red squares = vertically oriented CRS specimens, open cyan squares = horizontally oriented CRS specimens. Shipboard data are from the “Site C0011” and “Site C0012” chapters (Expedition 322 Scientists, 2010a, 2010b).

Previous | Close | Next | Top of page