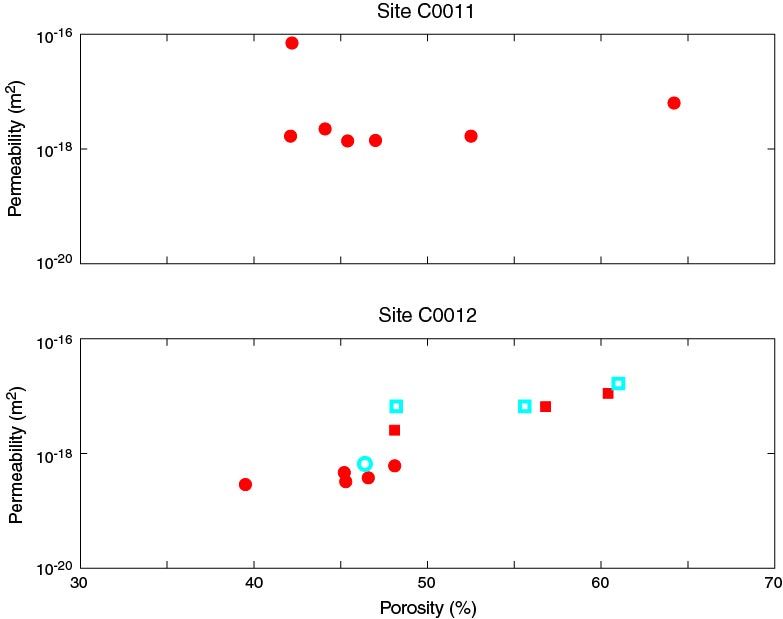
Figure F4. Permeability data for Sites C0011 and C0012 plotted with respect to porosity. Permeability is plotted on a log scale. Solid red circles = vertically oriented flow-through permeability specimens, open cyan circles = horizontally oriented flow-through permeability specimens, solid red squares = vertically oriented CRS specimens, open cyan squares = horizontally oriented CRS specimens.
Previous | Close | Top of page