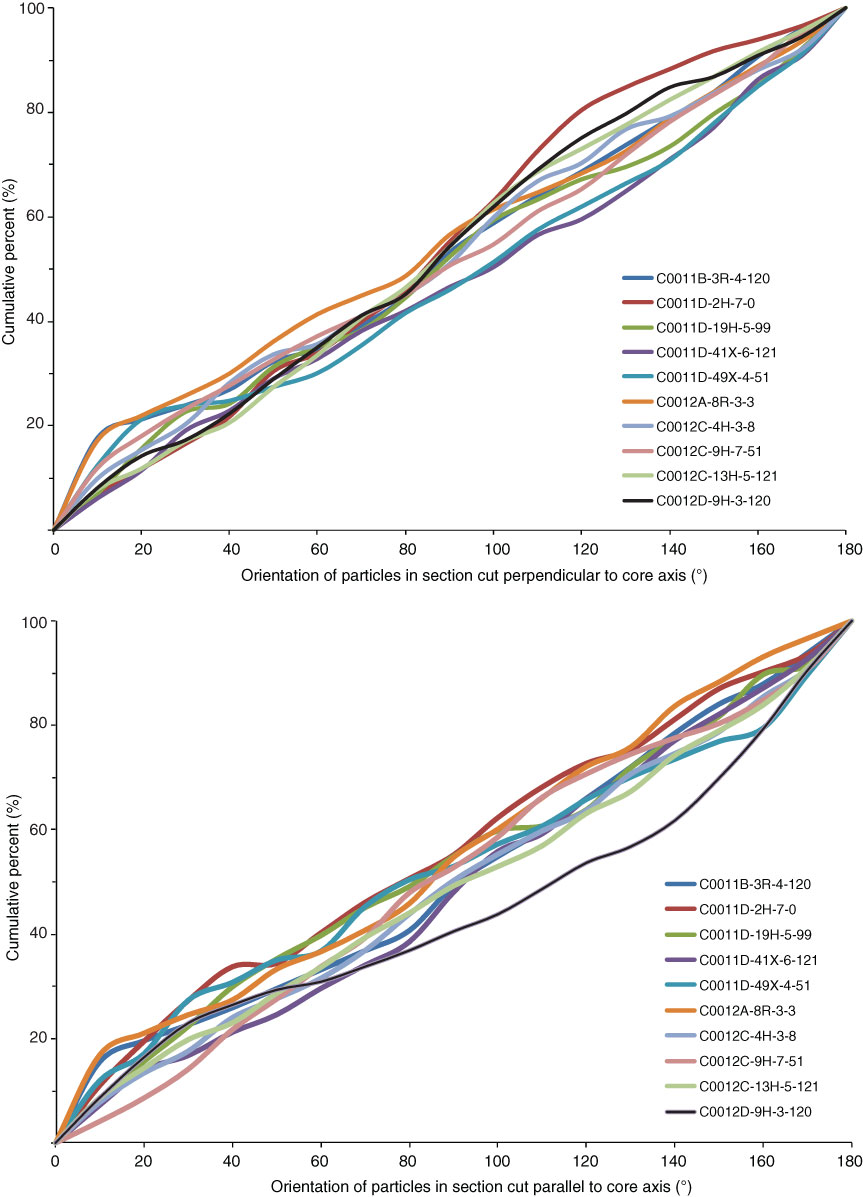
Figure F10. Cumulative frequency curves for grain orientations on horizontal sections (perpendicular to core axis) and vertical sections (parallel to core axis) imaged by environmental scanning electron microscope, Sites C0011 and C0012.
Previous | Close | Next | Top of page