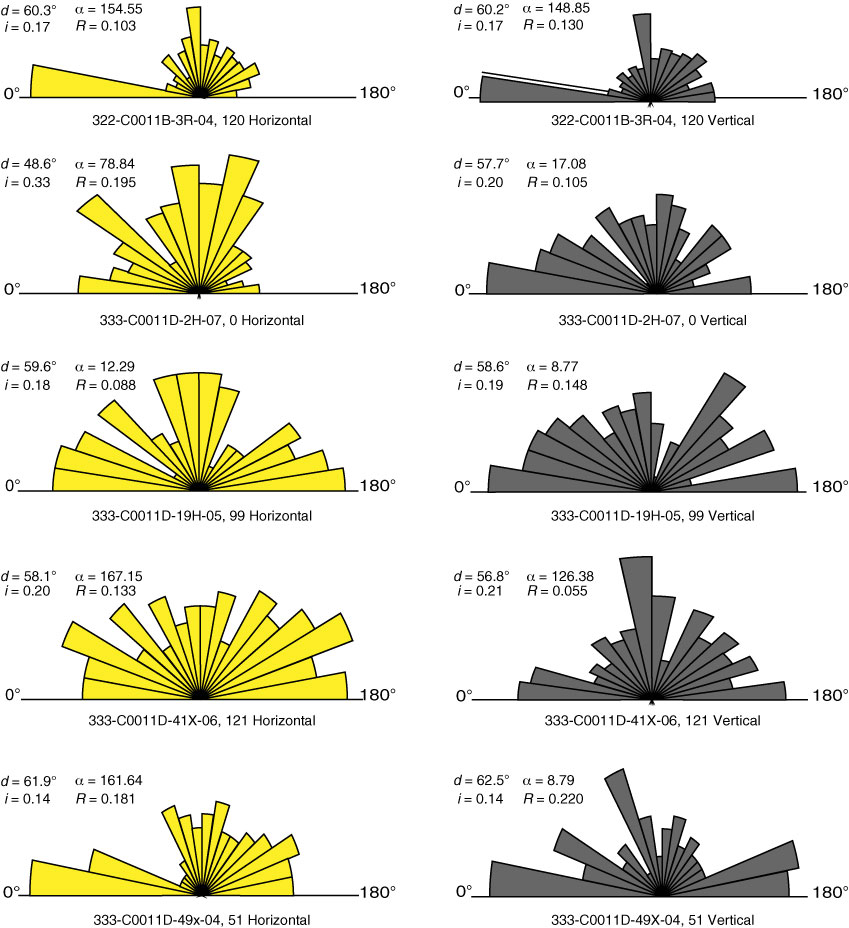
Figure F9. Orientation of grains (apparent long axis) measured on environmental scanning electron microscope (ESEM) images. Relative to the core axis, sections were cut parallel (vertical) and perpendicular (horizontal). See Figure F6 for the corresponding ESEM images. Also shown are values of standard deviation (d) for grain orientation, values of microfabric orientation index (i), values of resultant vector length (R), and the mean angle (α) of the angular distribution. (Continued on next page.)
Previous | Close | Next | Top of page