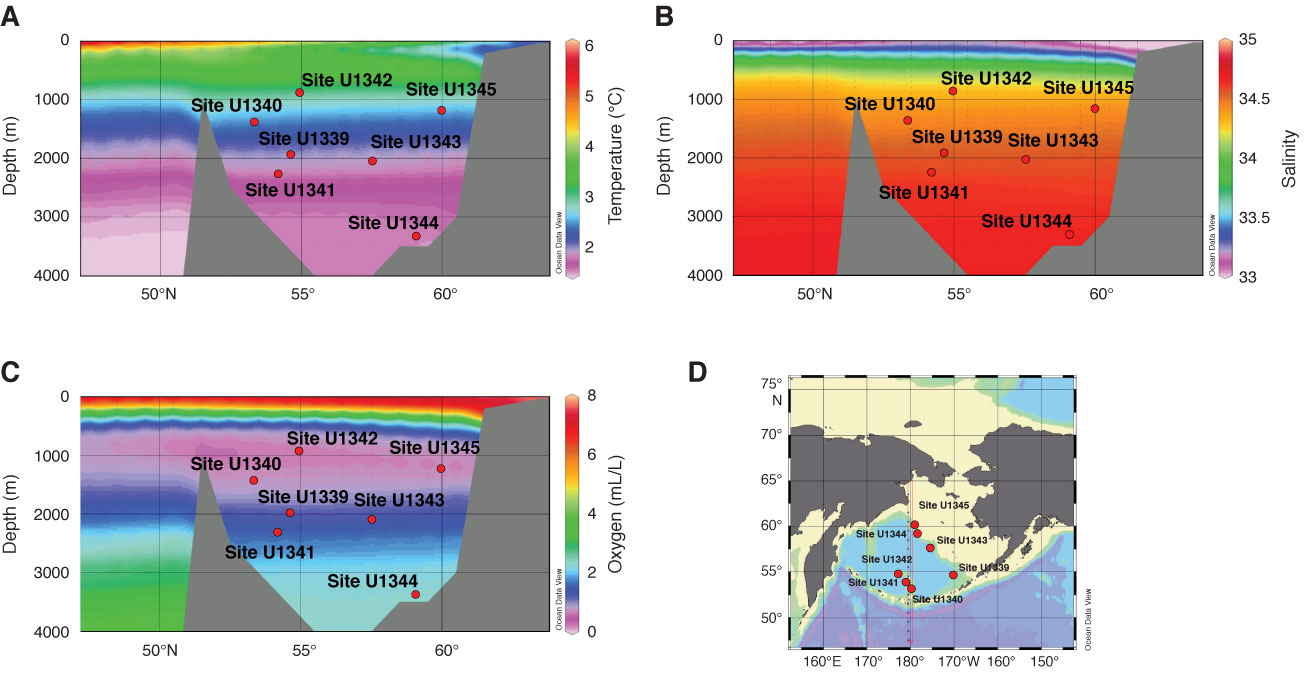
Figure F4. Vertical profiles of (A) temperature, (B) salinity, and (C) dissolved oxygen and (D) along the transect on 180° on the map of the Bering Sea (data from World Ocean Atlas [2005]; figures drawn by Ocean Data View).
Previous | Close | Next | Top of page