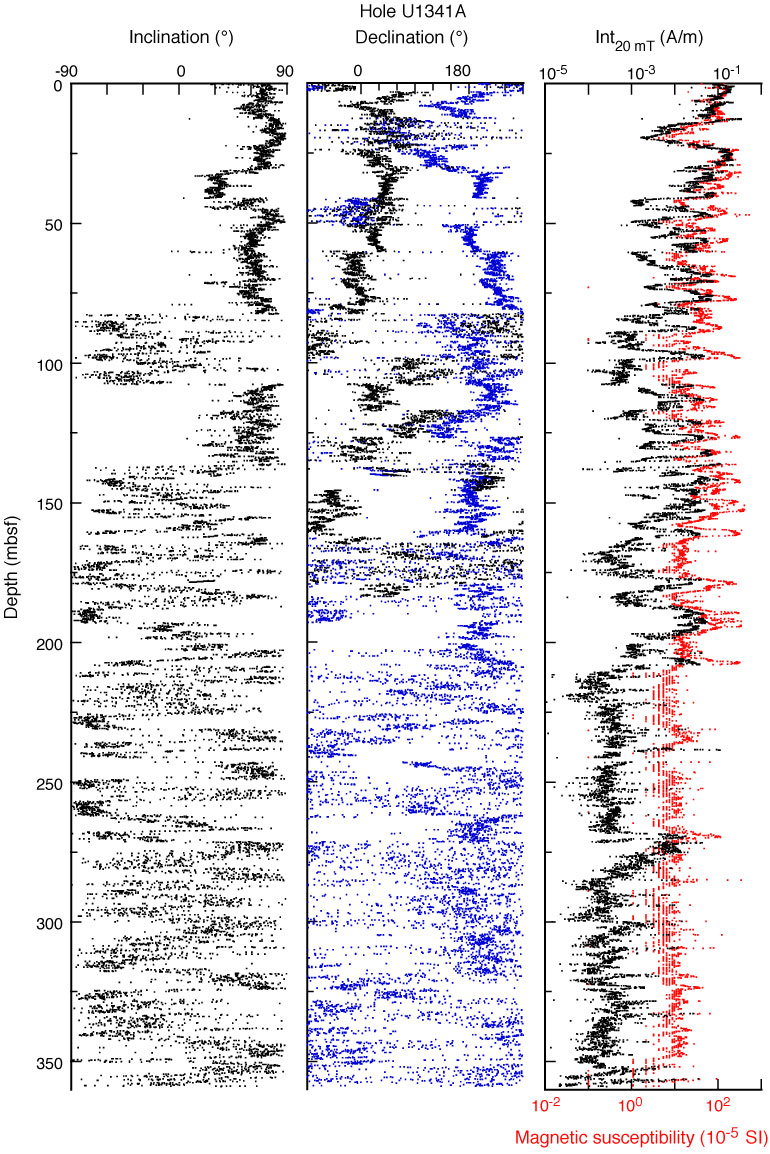
Figure F15. Inclination, declination, and intensity of remanent magnetization after 20 mT AF demagnetization (Int20 mT), Hole U1341A. Intensity data (black) are shown with STMSL magnetic susceptibility data (red). In the declination diagram, blue dots = raw data and black dots = values corrected using FlexIt orientation tool data.
Previous | Close | Next | Top of page