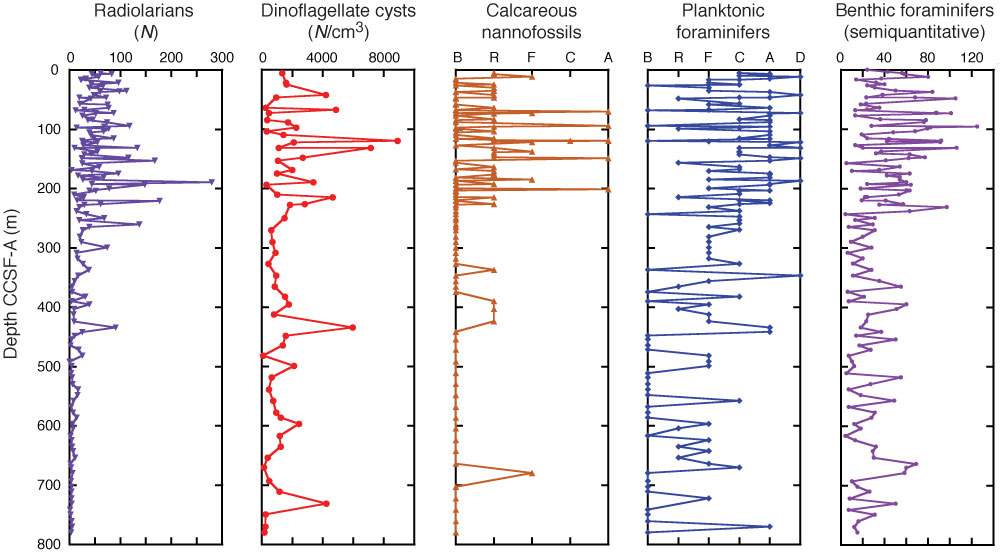
Figure F14. Abundance estimations for all major groups of fossils except diatoms. The data shown are from Holes U1343A–U1343E (radiolarians and planktonic and benthic foraminifers); Holes U1343A, U1343C, and part of Hole U1343E (calcareous nannofossils); and Hole U1343A and part of Hole U1343E (dinoflagellate cysts). B = barren, R = rare, F = few, C = common, A = abundant, D = dominant. For benthic foraminifer abundance estimates, see "Biostratigraphy" in the "Methods" chapter.

Previous | Close | Next | Top of page