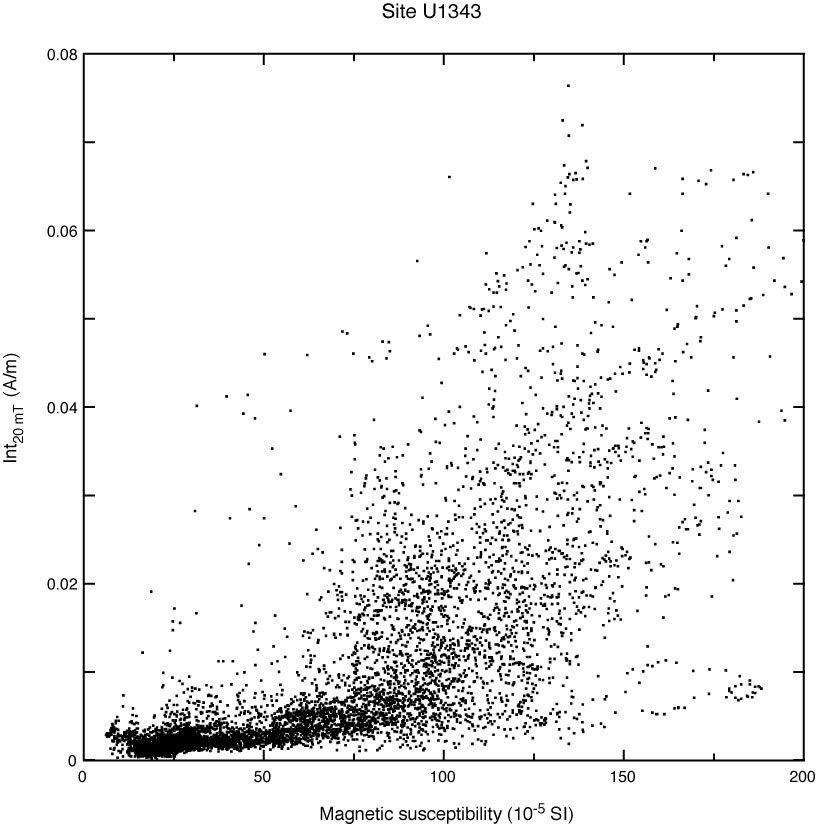
Figure F20. Intensity of remanent magnetization after 20 mT AF demagnetization (Int20 mT) plotted against magnetic susceptibility, Holes U1343A, U1343C, U1343D, and U1343E. Data are interpolated to have equal spacing of 5 cm.
Previous | Close | Next | Top of page