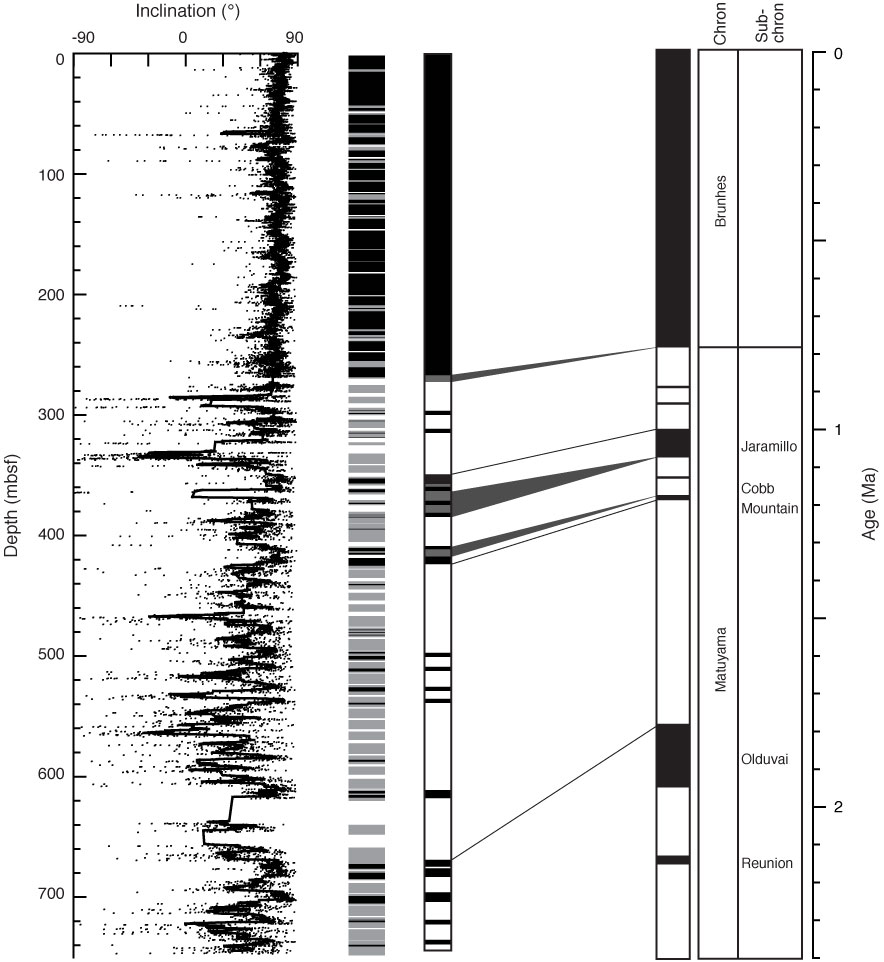
Figure F22. Inclination data (dots) and 60 point (corresponding to ~0.5 m) averaged inclination values (solid line) for Hole U1344A, along with tentative polarity zonation and presumable correlation with the polarity chrons. In the polarity zonation, black lines = normal polarity, gray lines = reversed or intermediate polarities, and white blanks = core gaps.
Previous | Close | Next | Top of page