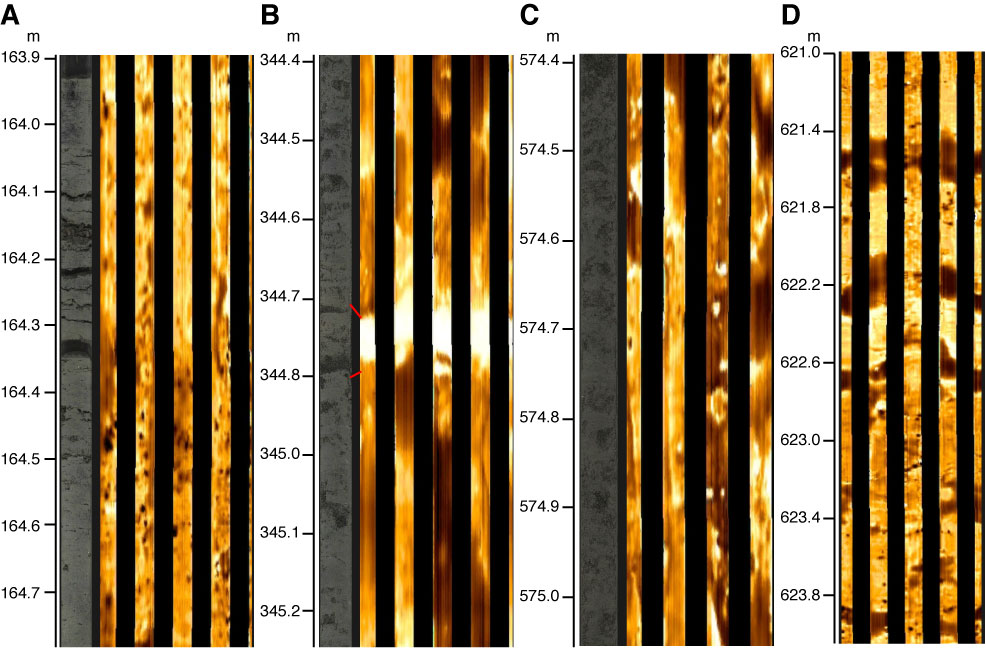
Figure F45. Correlation between FMS electrical images and core observations in each of the four logging units. A. Black sulfide speckles (Sections 323-U1344A-18H-3 and 18H-4), recognizable as black conductive features in the FMS images. B. Authigenic carbonates and a fine sand from logging Unit 2 (Section 323-U1344A-37X-4). These appear resistive in the images. C. White carbonate pebbles (Section 323-U1344A-61X-4). These occur in several places in logging Unit 3 and appear as bright resistive features in the FMS images. D. 3 m section of the 20 m interval not recovered at the top of logging Unit 4. The image shows conductive (dark) layers dipping steeply to the north, overlaying more conductive speckles similar to the sulfide speckles observed in several places in the hole. The contrast in some of the core images has been enhanced. Note the differences in vertical scale between images.
Previous | Close | Next | Top of page