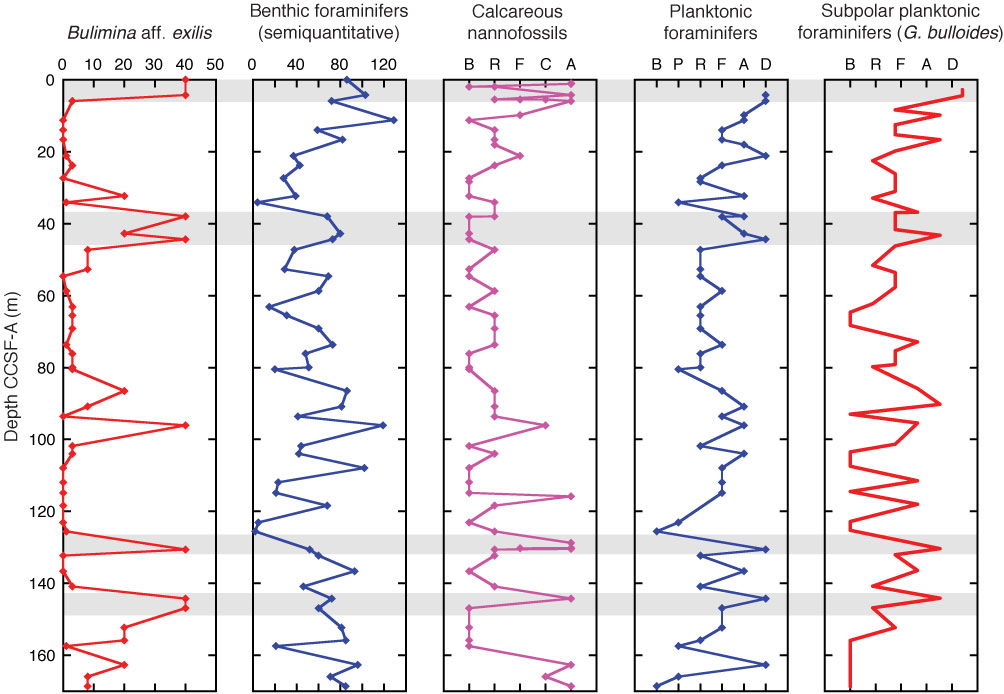
Figure F15. Microfossil abundances and selected species composition vs. composite depth, Site U1345. Gray bars = strongest interglacials (interpreted from all microfossil data). Calcareous nannofossil abundance: B = barren, R = rare, F = few, C = common, A = abundant. Planktonic foraminifer abundance: B = barren, P = present, R = rare, F = frequent, A = abundant, D = dominant. For benthic foraminifer abundance calculations, see "Biostratigraphy" in the "Methods" chapter.
Previous | Close | Next | Top of page