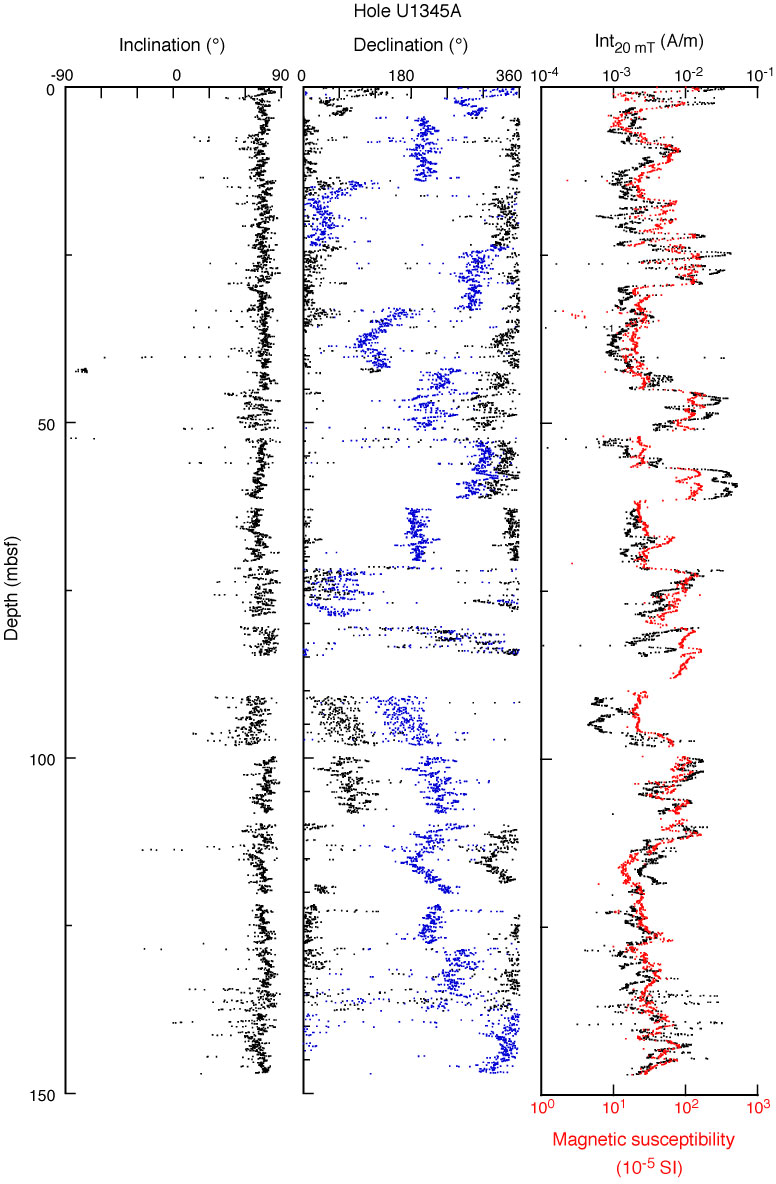
Figure F18. Inclination, declination, and intensity of remanent magnetization after 20 mT AF demagnetization (Int20 mT), Hole U1345A. Intensity data (black) are shown with STMSL magnetic susceptibility data (red).
Previous | Close | Next | Top of page