Previous | Close | Next
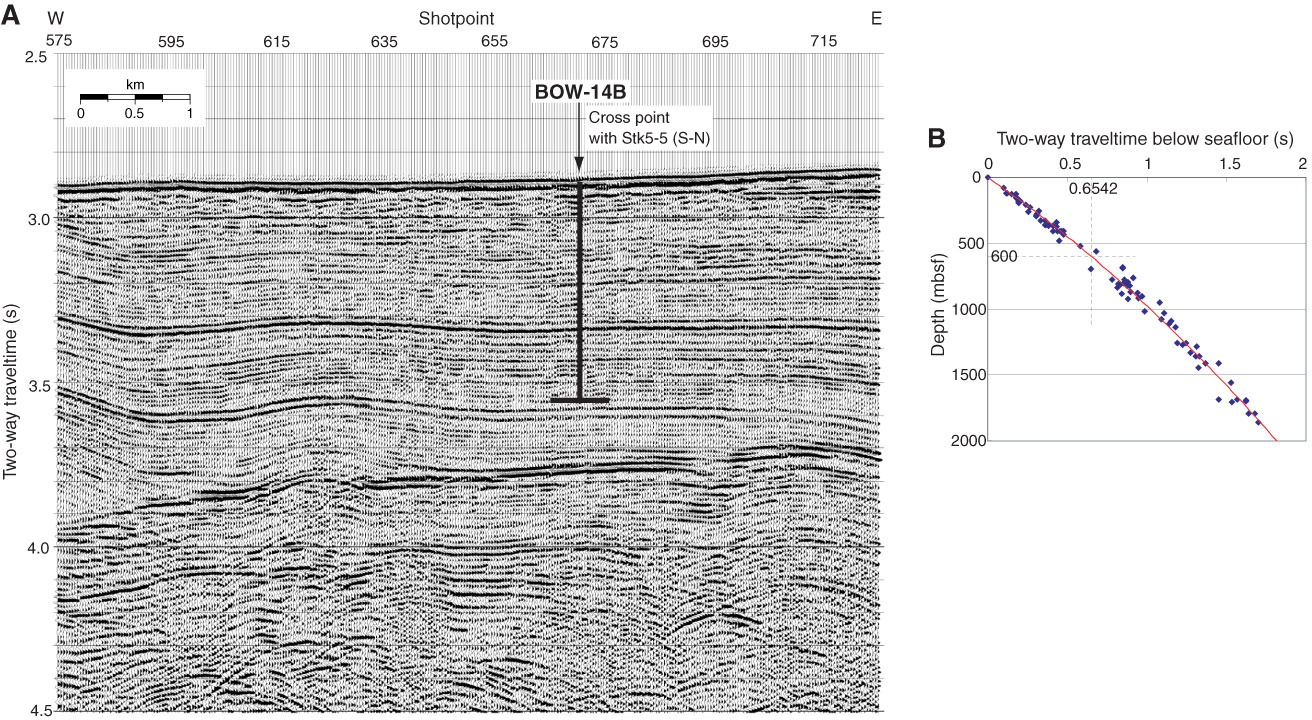
Figure F19. A. Close-up seismic profile for Line Stk5-1 (west–east) from Cruise KH99-3, Site BOW-14B. B. Time-depth curve estimated from results of velocity analyses on Lines Stk5-1 and Stk5-5.
Previous | Close | Next | Top of page