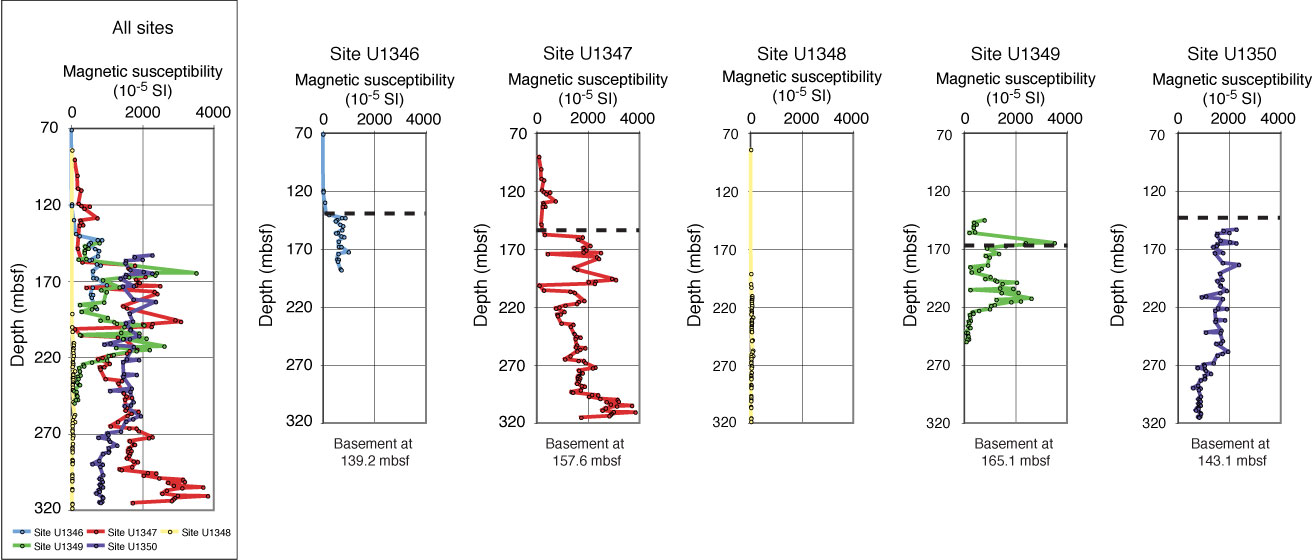
Figure F29. Summary of magnetic susceptibility measured from core sections, Expedition 324. All plots shown at same scale for comparison. As a result, low susceptibility units are not visible. Dashed line = contact between sediments and igneous basement.
Previous | Close | Next | Top of page