Previous | Close | Next
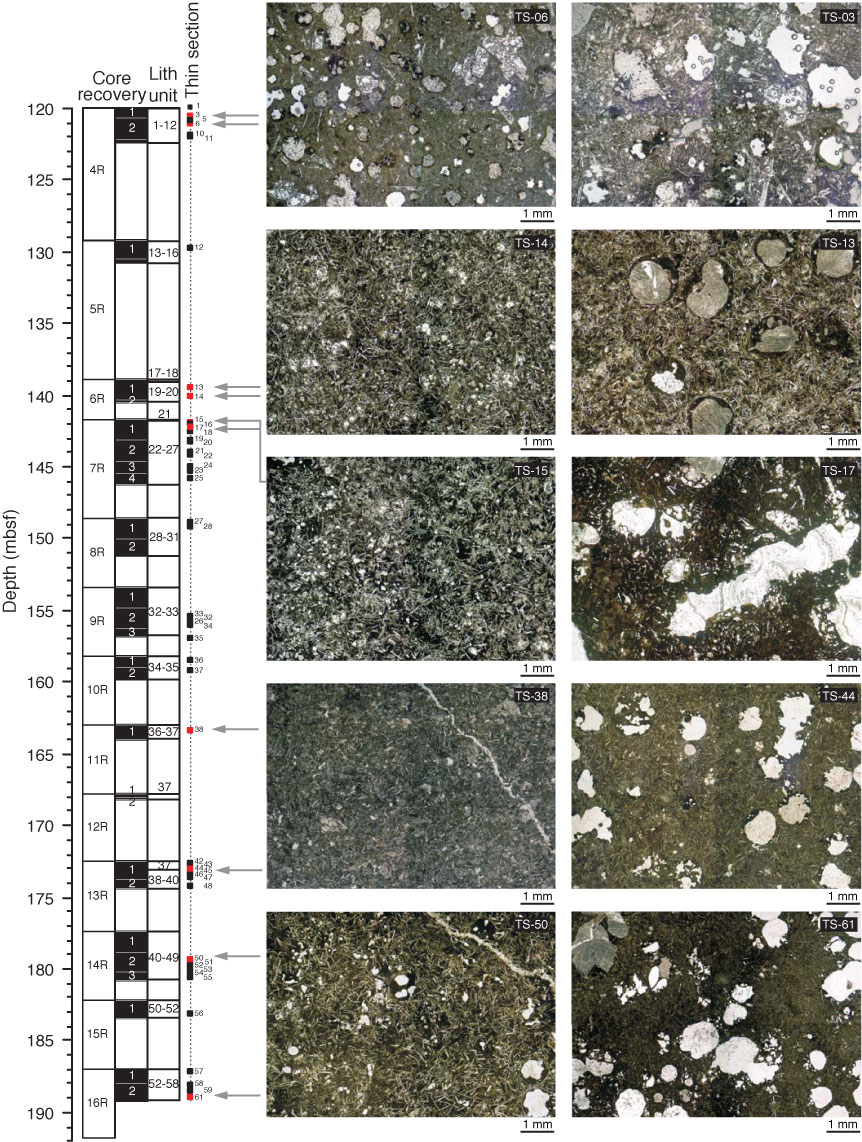
Figure F18. Photomicrographs of representative samples of downhole variations in groundmass and vesicularity. TS = thin section. All images are at the same scale.
Previous | Close | Next | Top of page