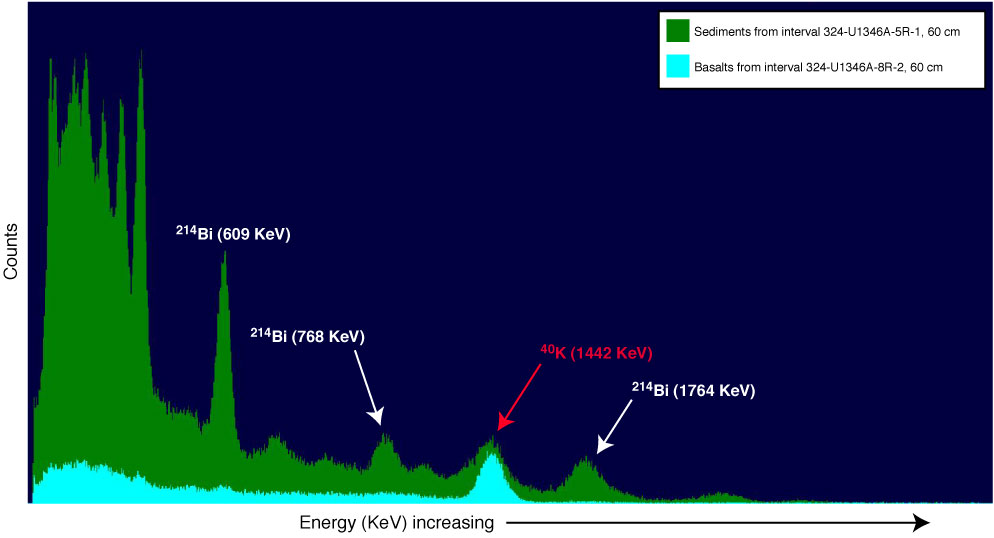
Figure F48. Example of gamma ray spectra generated by the Natural Gamma Ray Logger. Green spectrum is from the sedimentary sequence with high total counts (~180 cps) in interval 324-U1346A-5R-1, 60 cm. Blue spectrum is from basaltic interval 324-U1346A-8R-2, 60 cm, plotted on the same relative scale for direct comparison. The spectra show that basaltic counts are dominated by potassium, whereas the major contributor to the sedimentary sequence are daughter nuclides of the 238U decay chain, in particular 214Bi. The low energy spectra of the sedimentary section also consists mainly of 238U decay products such as 226Ra, 214Pb, and 214Po (individual peaks not labeled).
Previous | Close | Next | Top of page