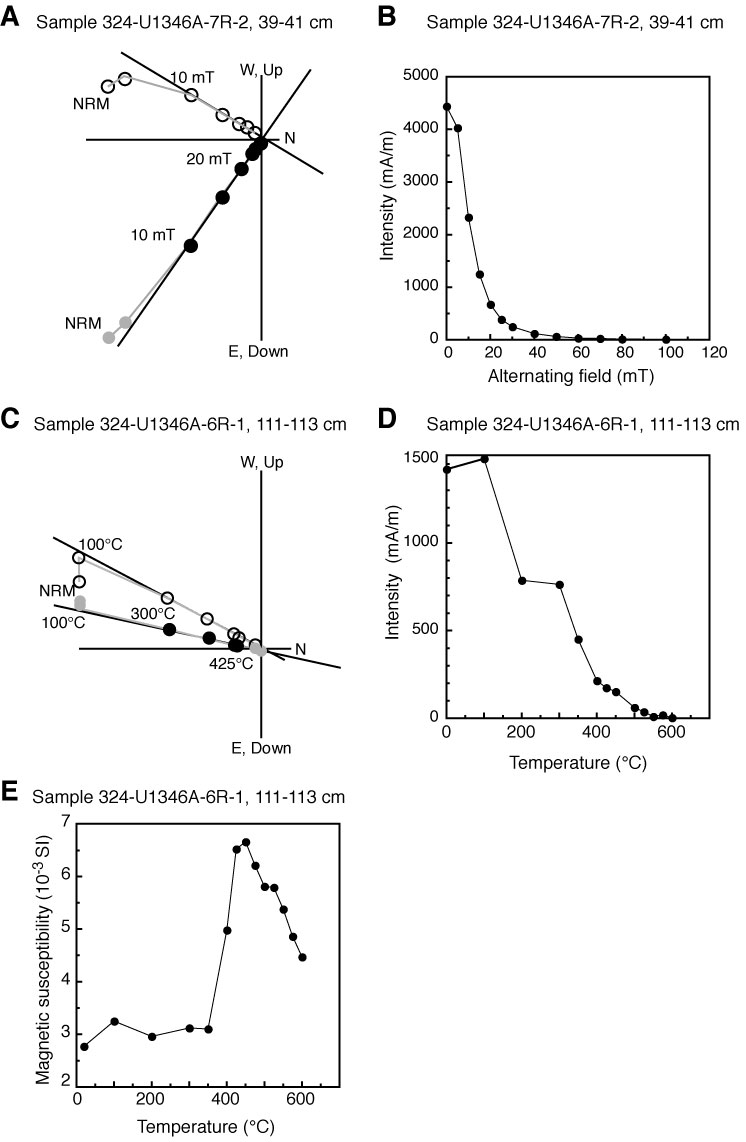
Figure F51. Example orthogonal vector plots of alternating-field and thermal demagnetization results, Hole U1346A. Open circles = inclinations, solid circles = declinations. NRM = natural remanent magnetization, gray circles and lines = demagnetization steps that were not used in the PCA calculation. (A) Zijderveld diagram and (B) intensity spectrum during alternating-field demagnetization of Sample 324-U1346A-7R-2, 39–41 cm. (C) Zijderveld diagram and (D) intensity spectrum and (E) magnetic susceptibility variation during thermal demagnetization of Sample 324-U1346A-6R-1, 111–113 cm.
Previous | Close | Next | Top of page