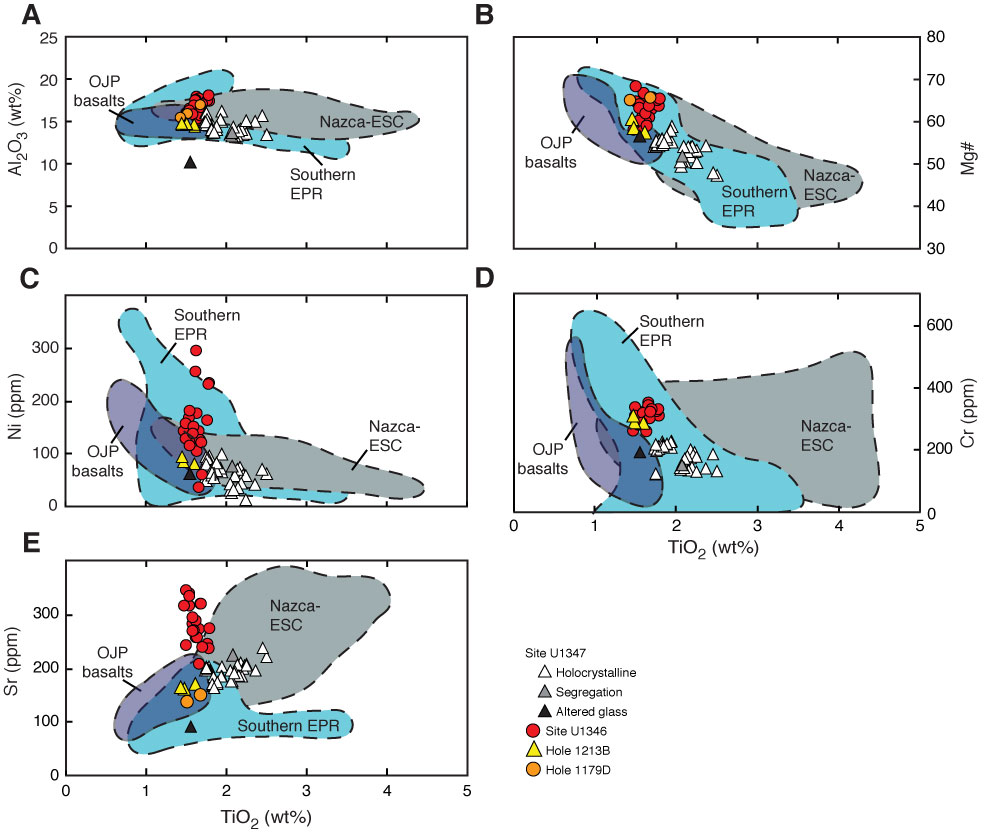
Figure F52. Plots of TiO2 vs. (A) Al2O3, (B) Mg#, (C) Ni, (D) Cr, and (E) Sr. Major element values normalized to 100 wt% totals. Mg# = 100 × Mg2+/(Mg2+ + Fe2+), assuming that Fe2O3/FeO = 0.15. Data for two carbonate-rich vein samples from Site U1346 are not shown. OJP = Ontong Java Plateau (data of Tejada et al., 1996, 2002; Fitton and Godard, 2004), EPR = East Pacific Rise (data of Sinton et al., 1991; Bach et al., 1994; Mahoney et al., 1994), Nazca-ESC = Nazca Ridge and Easter seamount chain (data of Ray et al., submitted).
Previous | Close | Next | Top of page