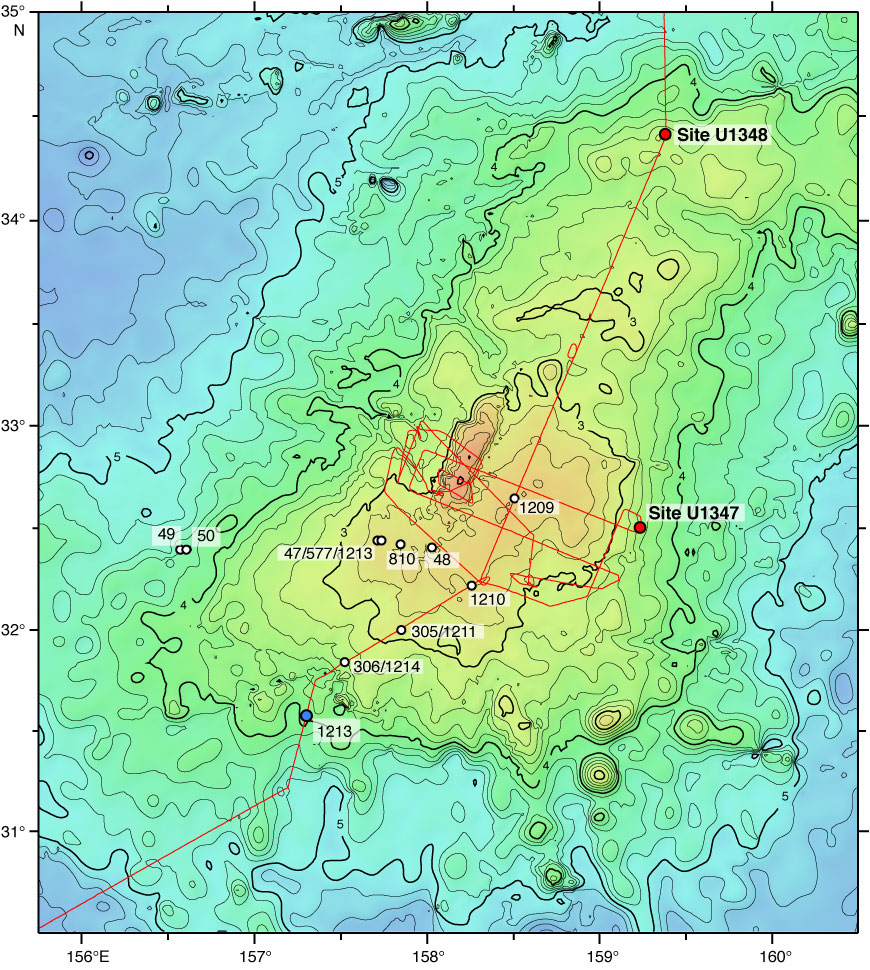
Figure F1. Bathymetry of Tamu Massif and location of Sites U1347 and U1348. Contours and colors indicate bathymetric depths predicted by satellite altimetry (Smith and Sandwell, 1997). Contours shown at 200 m intervals; dark contours shown for kilometer multiples. Red line = track of Cruise TN037 site survey (Klaus and Sager, 2002), open circles = prior drill sites, blue circle = location of Site 1213.
Close | Next | Top of page