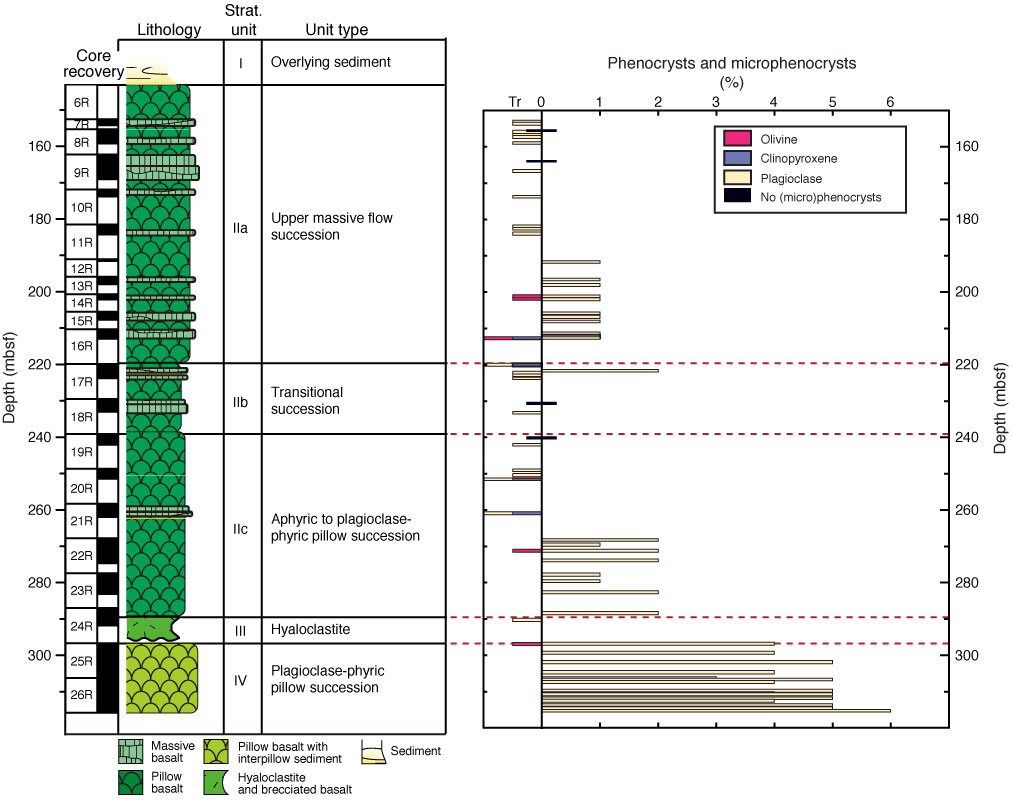
Figure F20. Depth profiles of modal abundances of olivine, clinopyroxene, and plagioclase occurring as either phenocrysts or microphenocrysts observed in thin section. Red dotted lines = recovered depths of unit boundaries. Tr = trace of phenocryst phases only, displayed for convenience as –0.5%.
Previous | Close | Next | Top of page