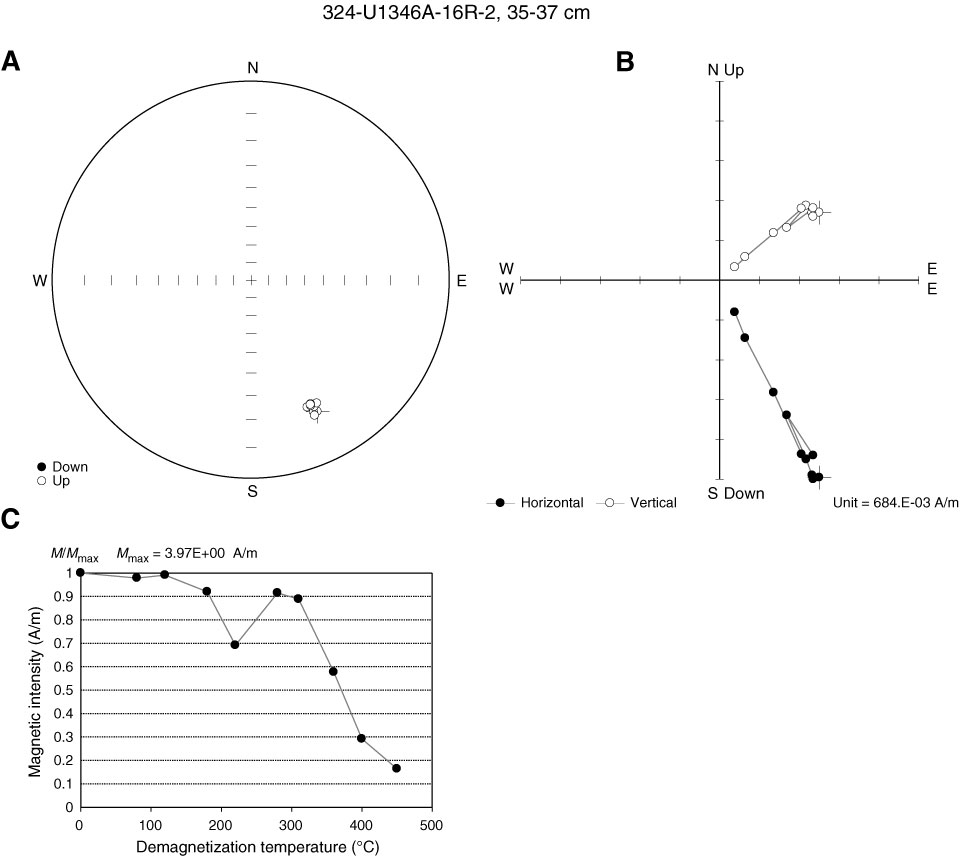
Figure F5. Thermal demagnetization results (Sample 324-U1346A-16R-2, 35–37 cm). A. Equal angle spherical projection. B. Zijderveld plot. C. Magnetic intensity vs. demagnetization temperature. This example shows behavior typical of thermally demagnetized samples at this site and a segment of partial self-reversal in the demagnetization path.
Previous | Close | Next | Top of page