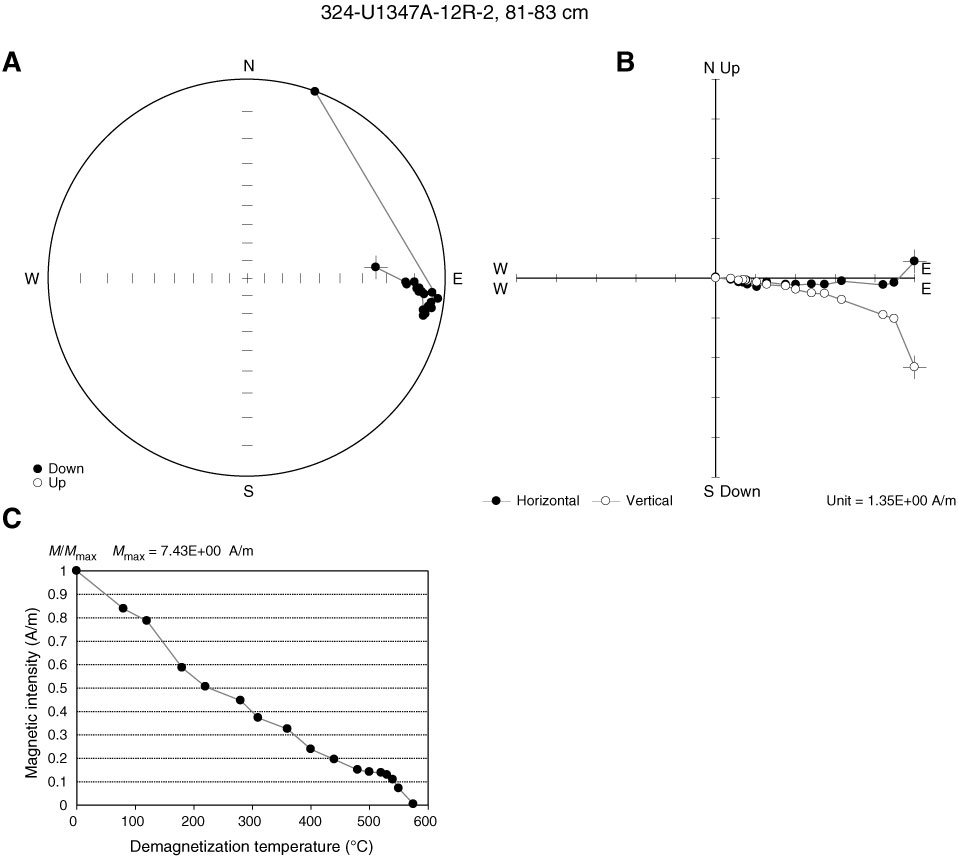
Figure F9. Thermal demagnetization results (Sample 324-U1347A-12R-2, 81–83 cm). A. Equal angle spherical projection. B. Zijderveld plot. C. Magnetic intensity vs. demagnetization temperature. This sample exhibits a linear decay of magnetization with increased heating. The last step at 575°C is inconsistent because sample was fully demagnetized at that temperature.
Previous | Close | Next | Top of page