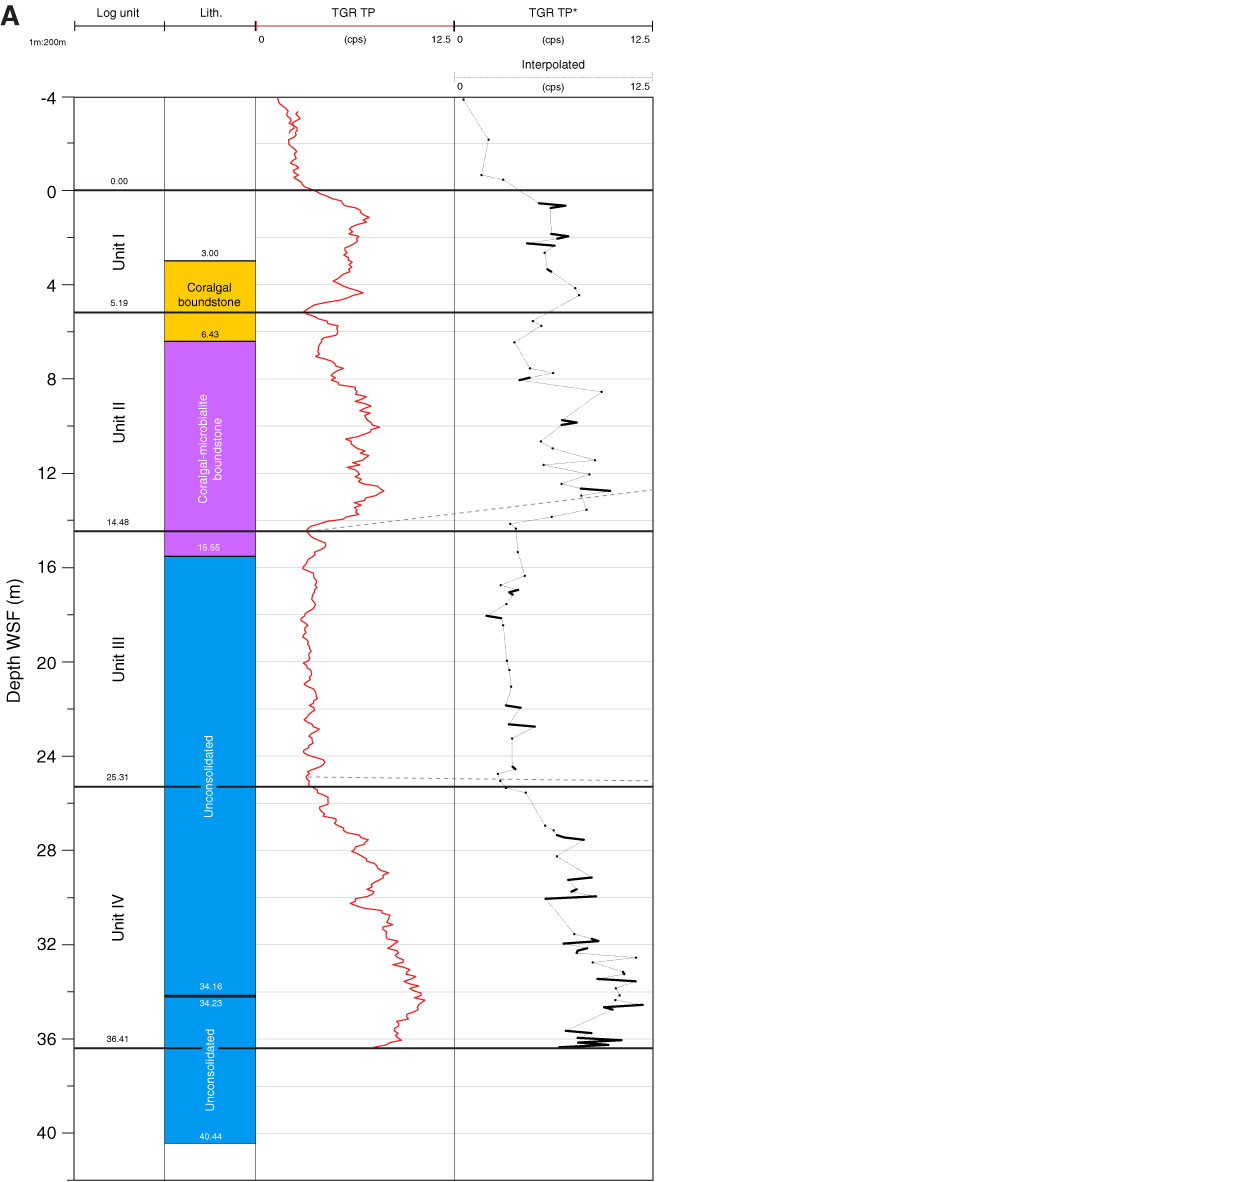
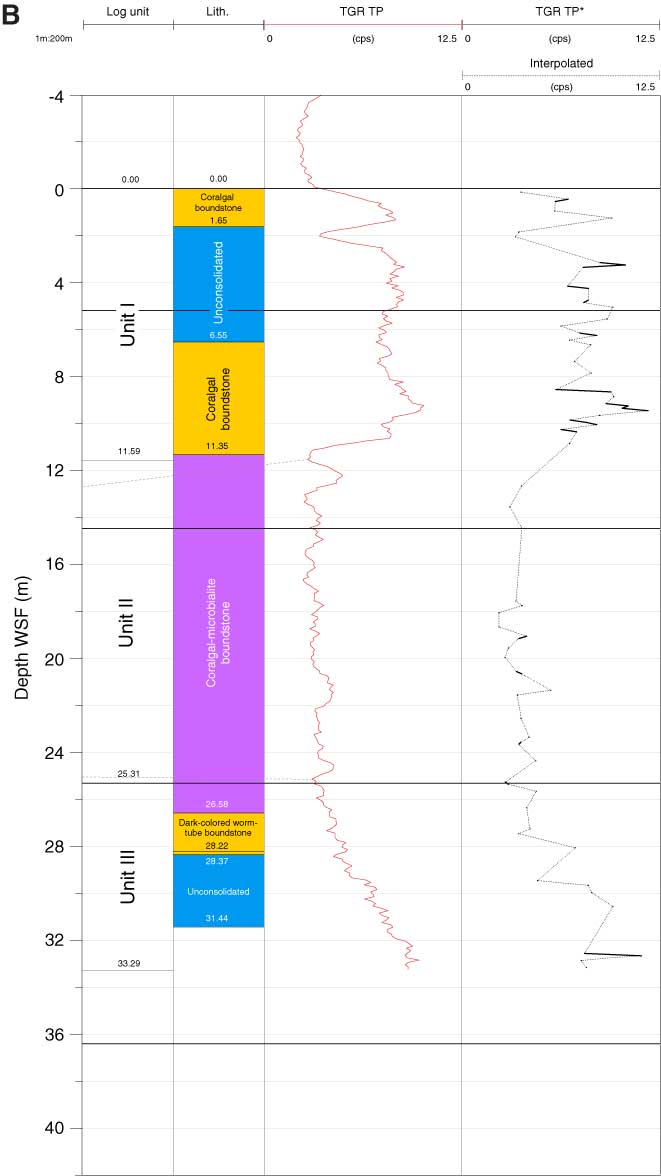
Figure F130. Composite comparing the total gamma ray (TGR) curve measured through pipe (TP) in Hole M0031A to the TGR (TP) log acquired in Hole M0036A. TGR (TP) with negative concentration values removed is overlain by an interpolation line. Dashed gray lines denote possible correlations between the two logs. Please note the two holes are ~800 m apart, and Hole M0031A is situated in shallower water. A. Hole M0031A. B. Hole M0036A.
Previous | Close | Top of page