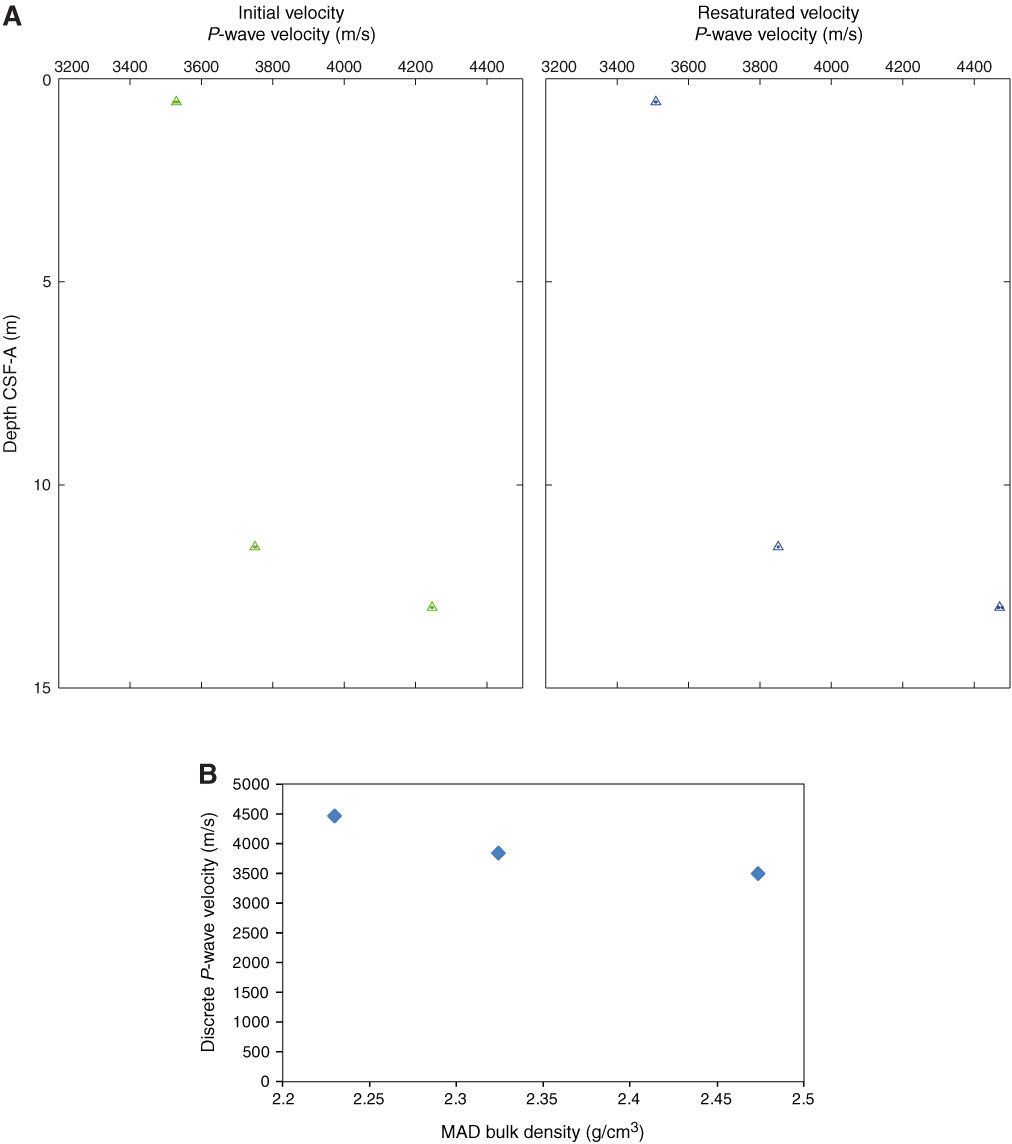
Figure F60. P-wave velocity data, Hole M0034A. A. Plot of initial, dry, and resaturated P-wave velocity measurements on discrete samples vs. depth. Three measurements were taken at each depth and are denoted by a dot. Average values are plotted as an open triangle. B. Plot showing discrete P-wave velocity vs. discrete bulk density.
Previous | Close | Next | Top of page