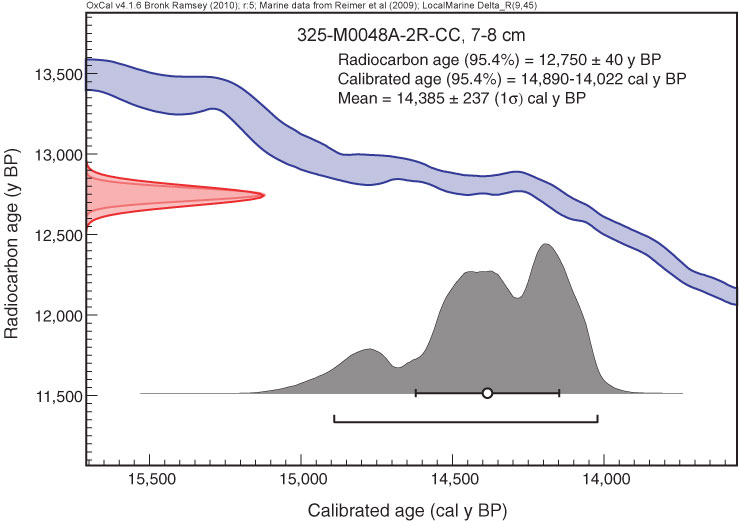
Figure F87. Preliminary chronology for Hole M0048A. Radiocarbon data are presented as graphs with the uncalibrated radiocarbon age and uncertainty shown as the red normal distribution on the ordinate axis and the probability distribution of the calibrated age shown in gray on the abscissa. The marine09 calibration curve is shown in blue. Horizontal bars indicate portions of the age distribution that are significant at the 95.4% confidence interval and the mean age (white circle ±1 standard deviation) used for the purposes of preliminary dating. All ages are presented as thousands of calendar years BP (1950 AD). See Table T10 in the “Methods” chapter. (See Bronk Ramsey [2009], as well as Bronk Ramsey [2010] at c14.arch.ox.ac.uk/oxcal.html.)

Previous | Close | Next | Top of page