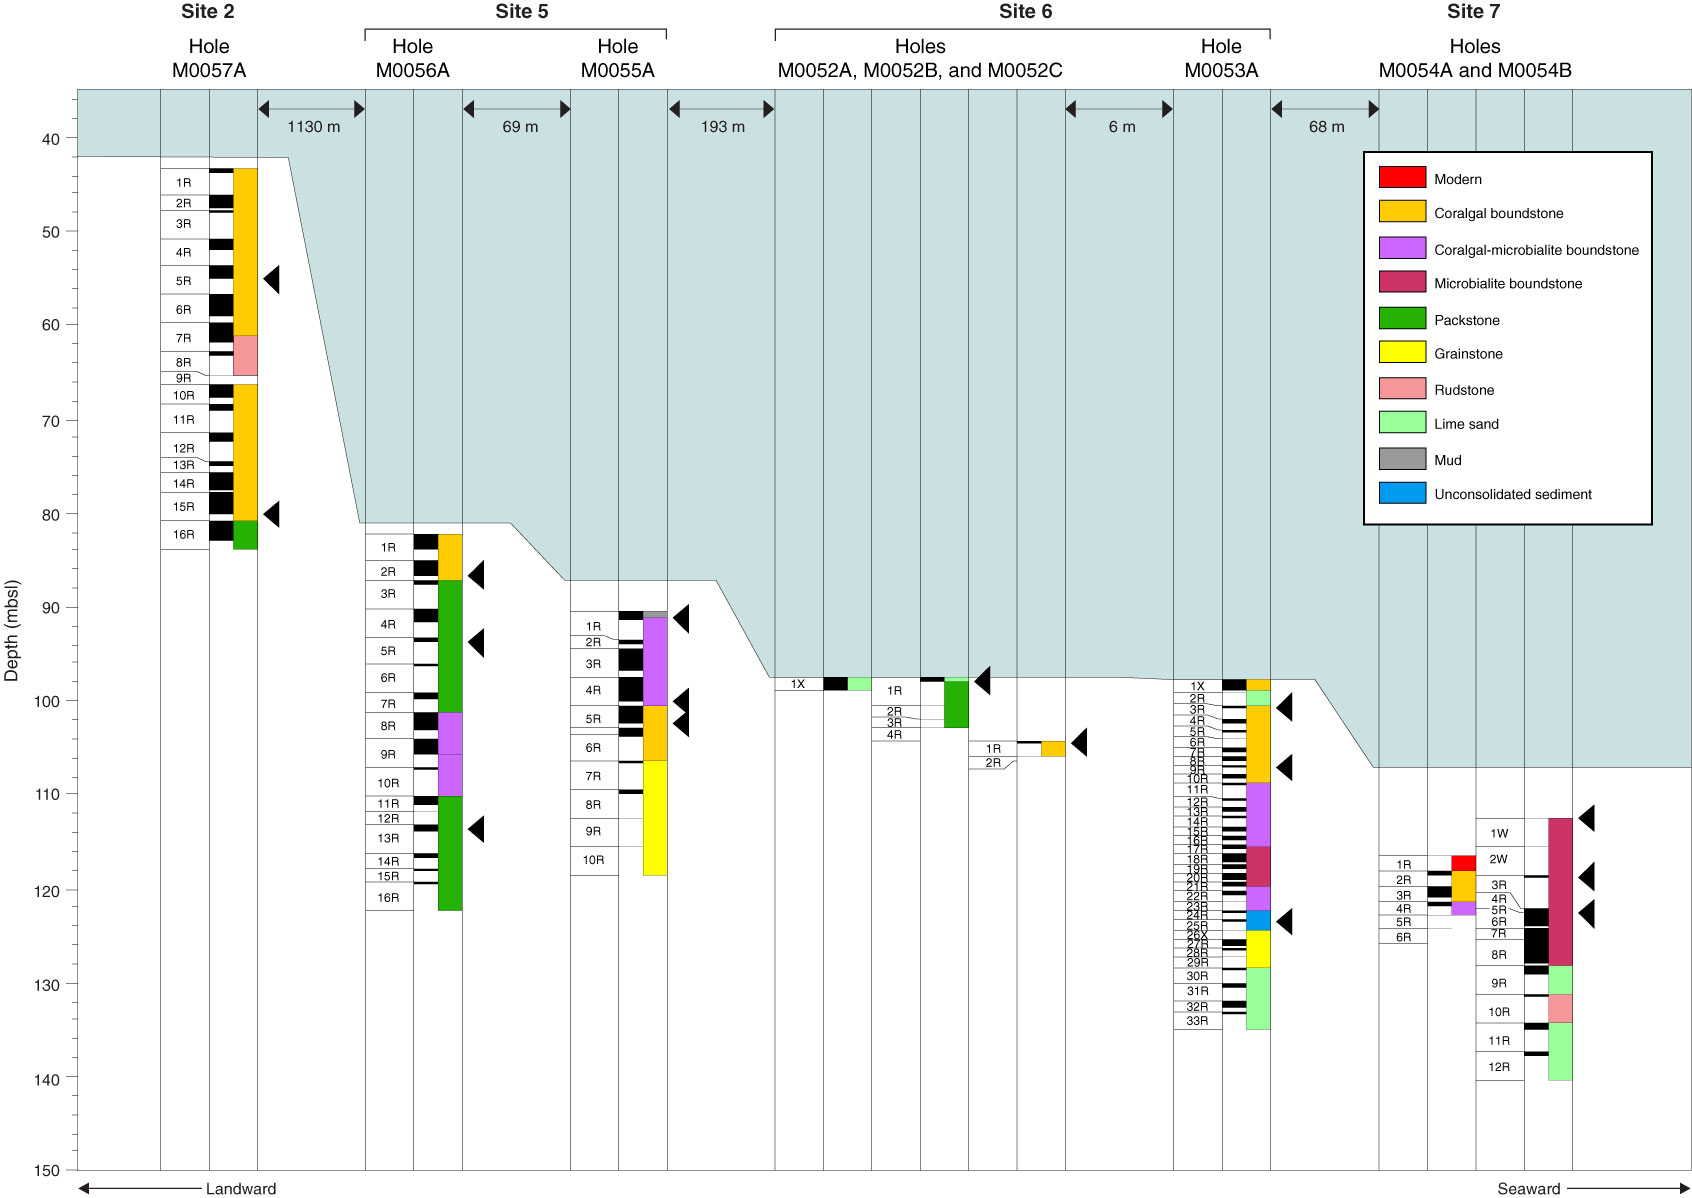
Figure F155. Transect summary of recovery and main lithostratigraphic units as interpreted for transect NOG-01B. Holes are plotted against present-day sea level (LAT taken from corrected EM300 multibeam bathymetry). Distances between holes are indicated on the diagram but are not drawn to horizontal scale.
Previous | Close | Next | Top of page