Previous | Close | Next
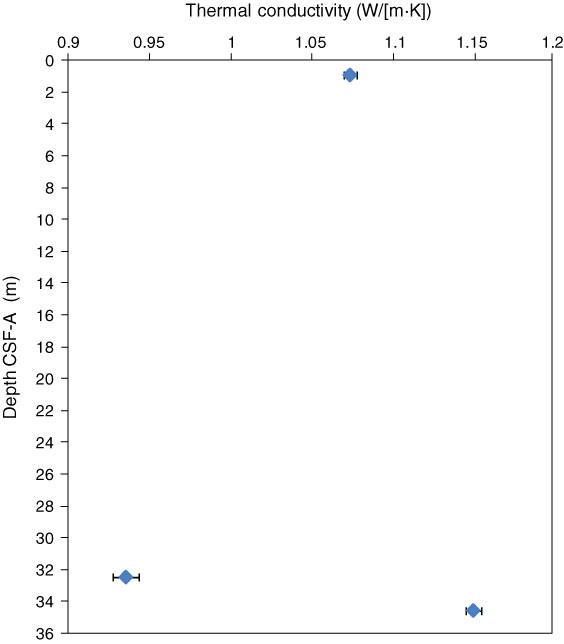
Figure F35. Plot of thermal conductivity vs. depth, Hole M0053A. Error bars indicate the standard deviation.
Previous | Close | Next | Top of page