Previous | Close | Next
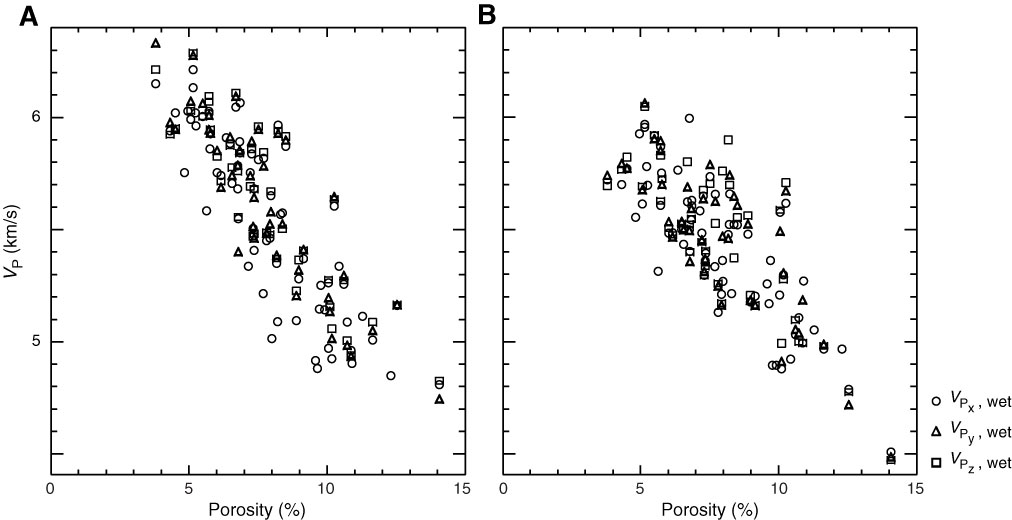
Figure F36. Plots of (A) automated and (B) manual P-wave velocity values vs. porosity, Hole U1362A.
Previous | Close | Next | Top of page