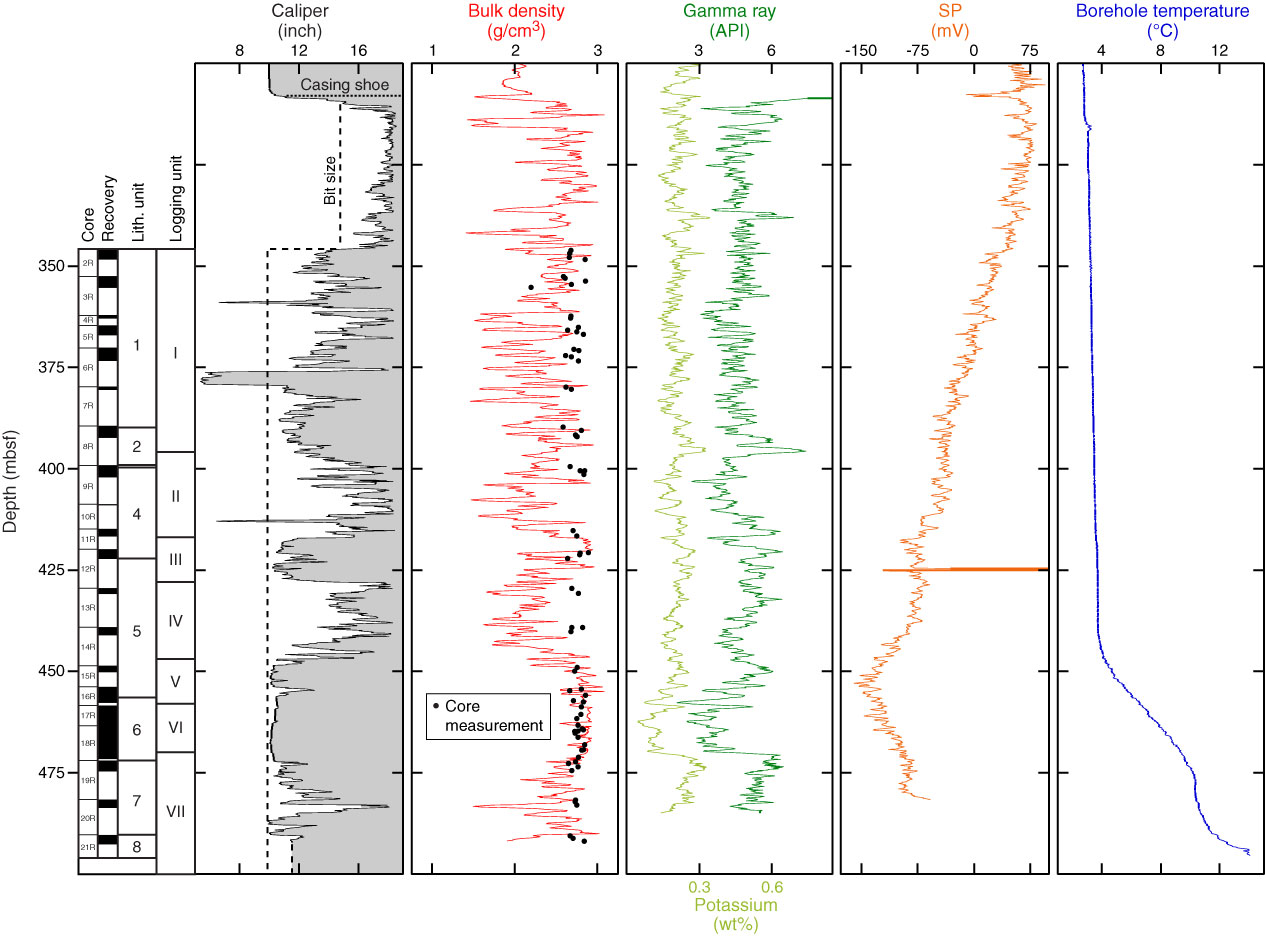
Figure F39. Plots of selected wireline logging measurements, Hole U1362A. All data are from the second logging pass. The mechanical single-arm caliper from the Hostile Environment Litho-Density Sonde (HLDS) is displayed. Total spectral gamma ray and computed potassium content are presented. Note that depth reflects the WMSF scale for logs and the CSF-A scale for core measurements. SP = spontaneous potential.
Previous | Close | Next | Top of page