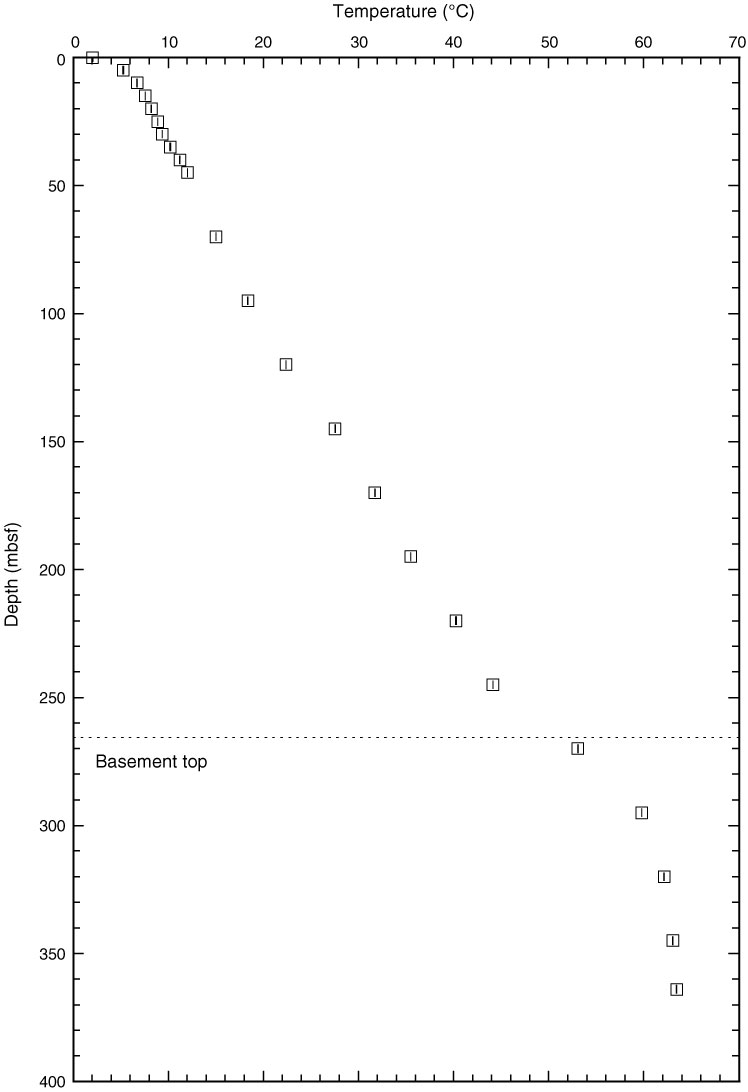
Figure F4. Plot of temperature vs. depth in the Hole U1301B CORK. Values shown comprise the means of 2–4 min of stable readings made at depths spaced 5 m apart from the seafloor to 50 mbsf and 25 m apart below that depth. Error bars (vertical lines inside of each square) indicate 2× the standard deviation of the values determined during the most stable period at each measurement depth.
Previous | Close | Next | Top of page