Previous | Close | Next
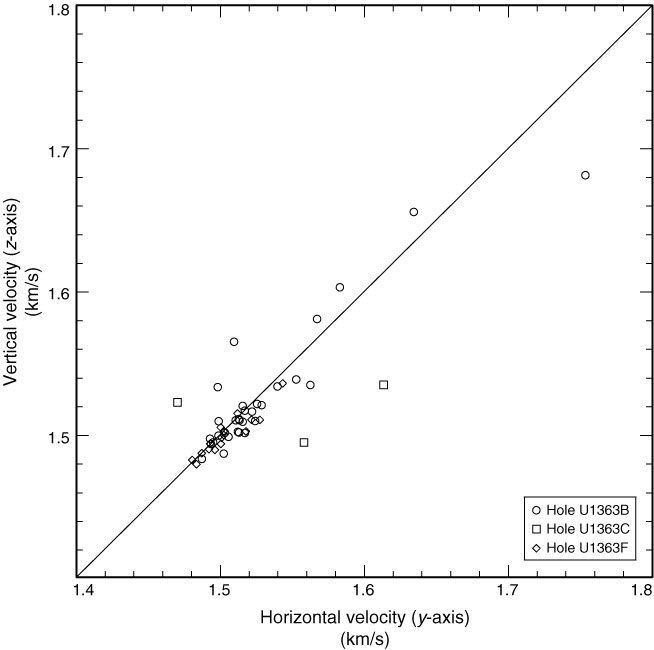
Figure F8. Cross-plot of horizontal and vertical P-wave velocities, Site U1363.
Previous | Close | Next | Top of page