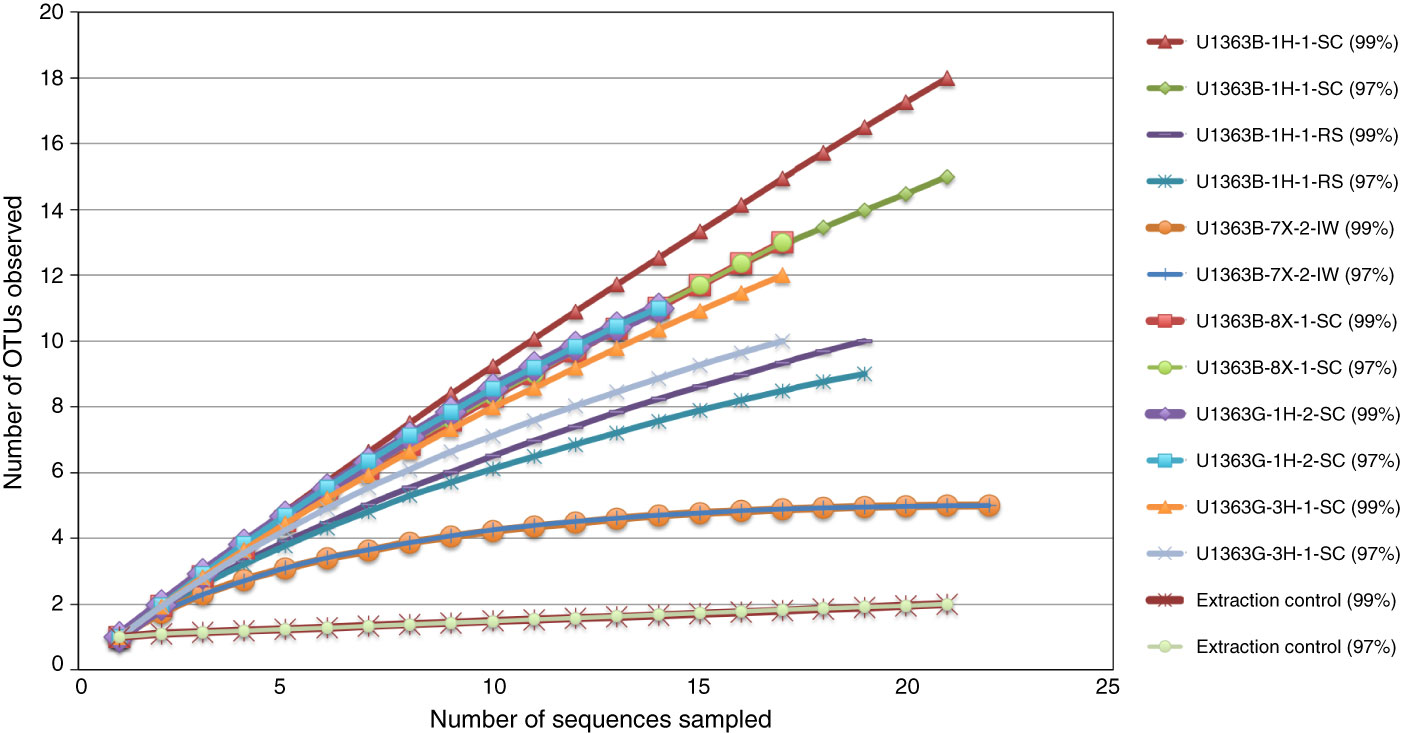
Figure F3. Rarefaction curves displaying the number of operational taxonomic units (OTUs) observed given the sequencing effort for Grizzly Bare sediment samples, Holes U1363B and U1363G. Data clustered at either 99% or 97% similarity cut-off values.
Previous | Close | Next | Top of page