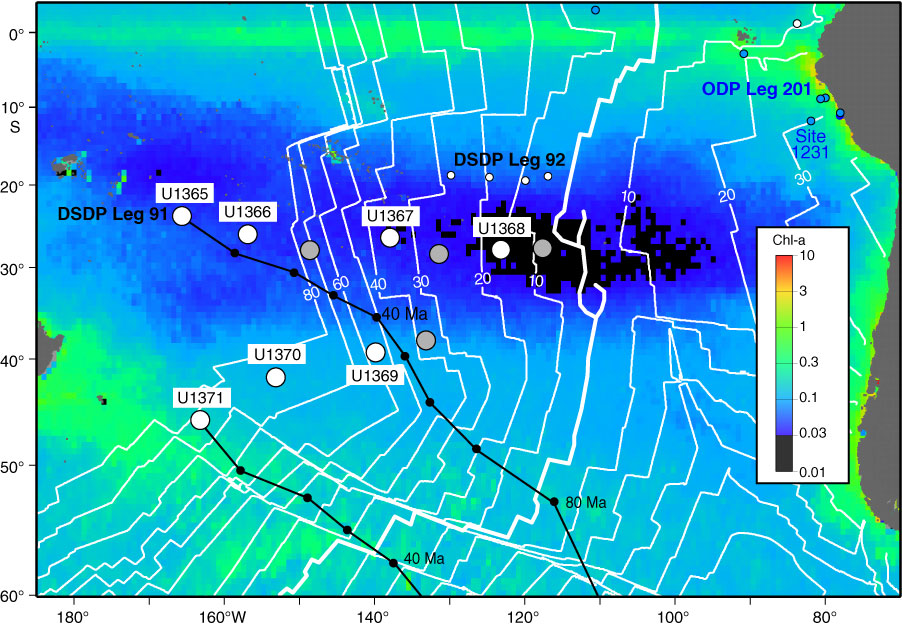
Figure F1. Map of annual chlorophyll-a (Chl-a) concentrations overlain by Expedition 329 site locations (white circles) and undrilled alternate site locations (gray circles). White lines indicate basement age in 10 m.y. increments. As illustrated by paleoposition histories of Sites U1365 (survey Site SPG-1A) and U1371 (survey Site SPG-12) (black lines), paleopositions determined with a fixed hotspot reference frame indicate that Sites U1365–U1369 have been in the gyre for tens of millions of years and Site U1371 has been at the gyre margin for tens of millions of years.
Close | Next | Top of page