Previous | Close | Next
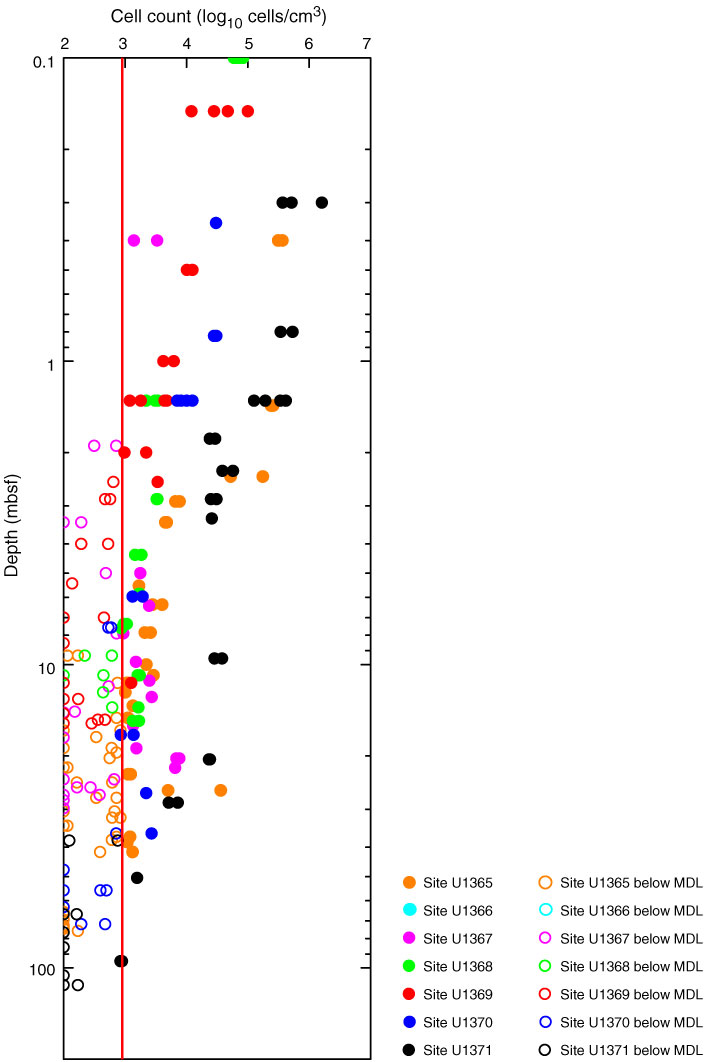
Figure F11. Plot of microbial cell counts vs. depth, Sites U1365–U1371. Minimum detection limit (MDL) is indicated by the red line.
Previous | Close | Next | Top of page