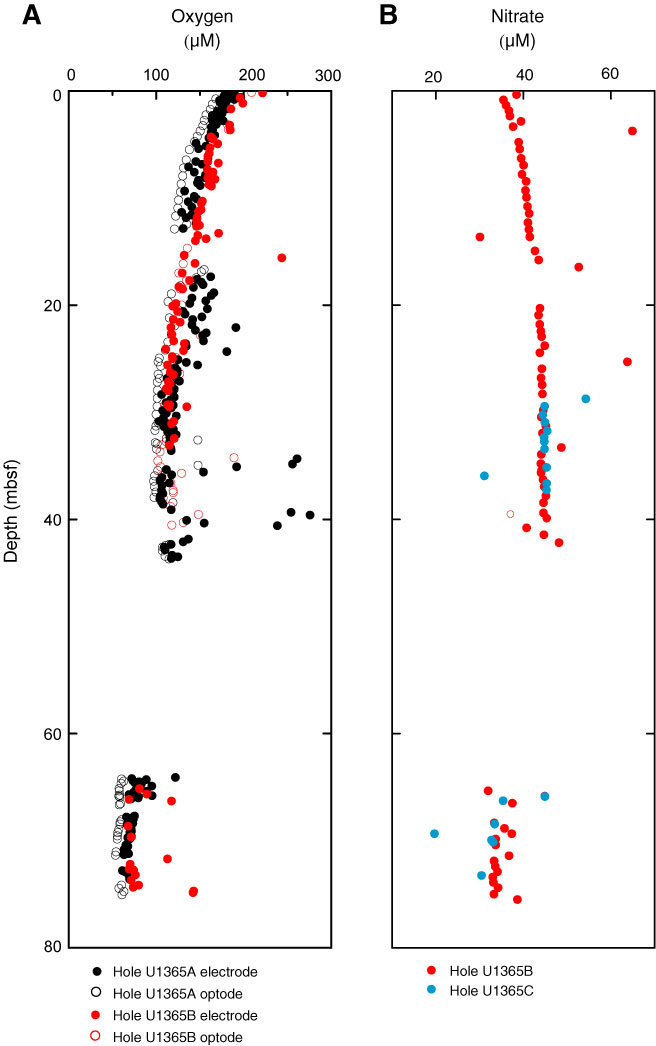
Figure F17. Plots of dissolved oxygen and dissolved nitrate, Site U1365. A. Dissolved oxygen concentrations on all cores. The figure includes measurements from core intervals that were observed before or during measurement to be compromised by core disturbance (flow-in, seawater intrusion, etc.). They are included to illustrate effects of core disturbance on dissolved oxygen measurements. B. Dissolved nitrate concentrations.

Previous | Close | Next | Top of page