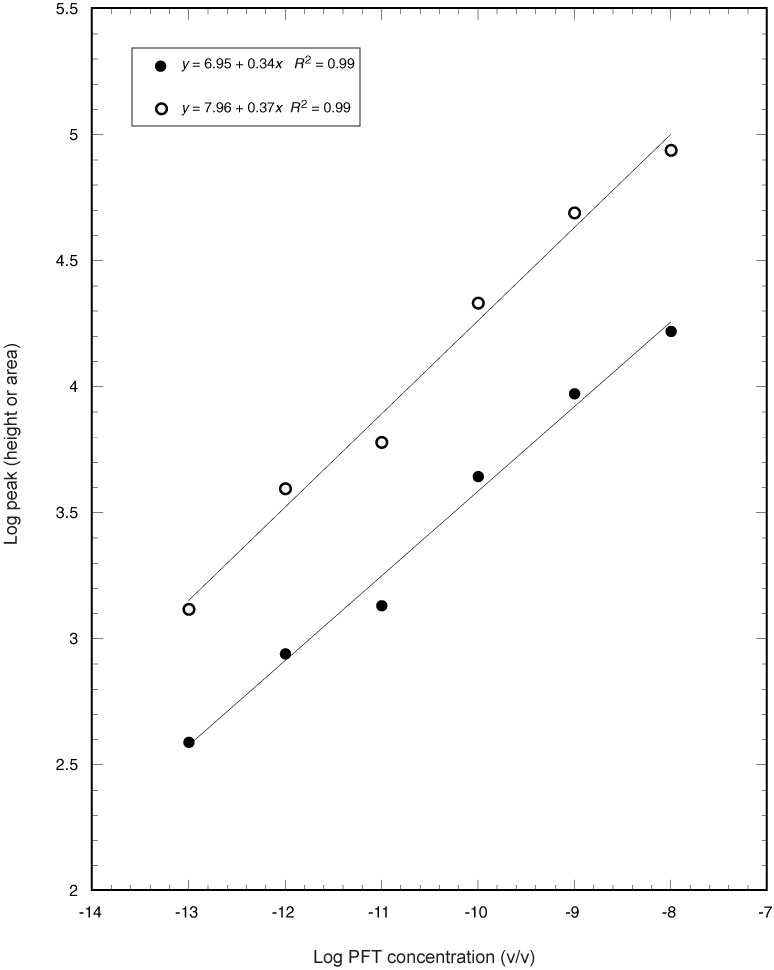
Figure F62. Calibration curves of perfluorocarbon tracer (PFT) on the gas chromatograph–electron capture detector with addition of iso-octane as solvent. Open circles indicate peak area and solid circles indicate peak height.

Previous | Close | Next | Top of page