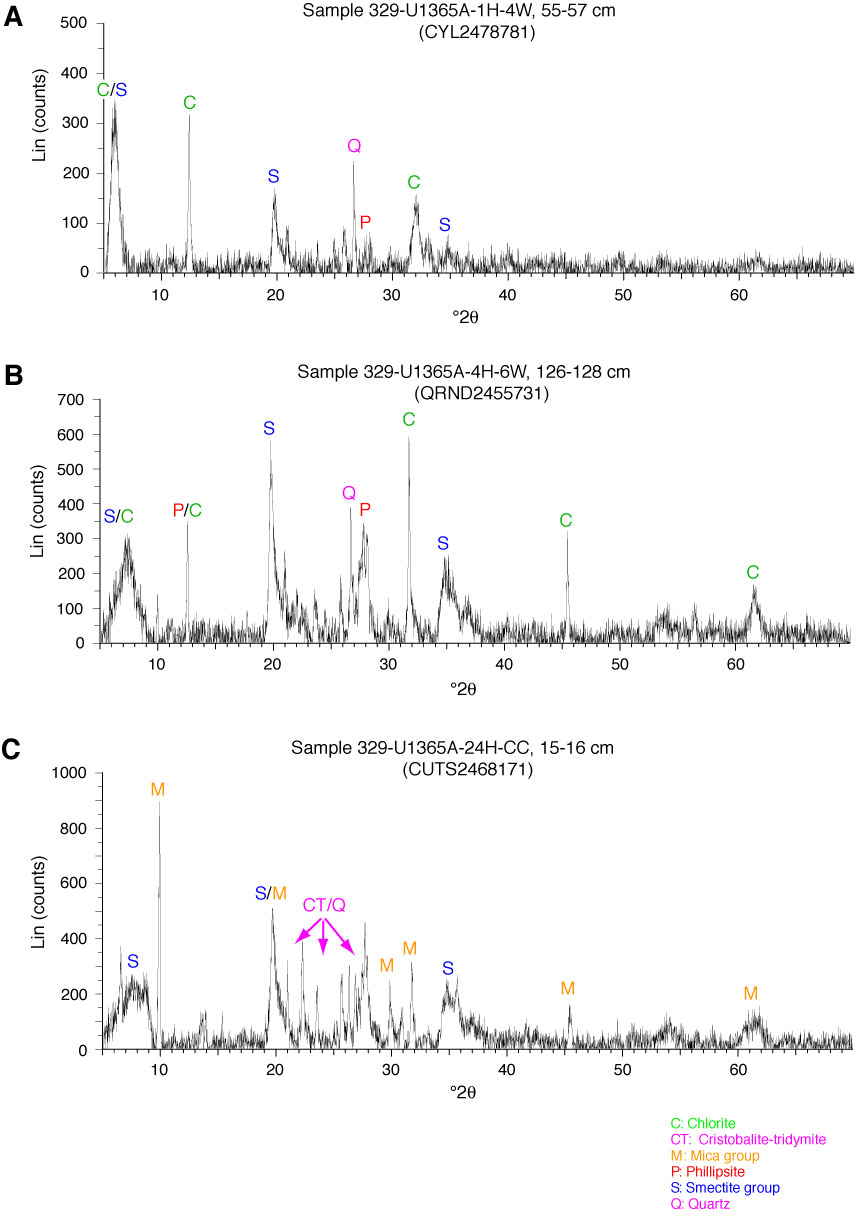
Figure F8. X-ray diffractograms illustrating mineral species, crystallinity, and relative abundance in Subunits IA and IB and Unit II. A. Sharp chlorite and poorly developed phillipsite peaks in Subunit IA. B. Chlorite peak masked by smectite group mineral peaks and well-developed phillipsite peak. C. Unit II chert exhibiting smectite and mica group minerals in addition to quartz and cristobalite/tridymite derivatives of opaline radiolarians.
Previous | Close | Next | Top of page